
Gantt Chart
Gantt Chart is a project management visual for Microsoft Power BI that tracks schedules, milestones, and resource workloads.
ChartPadFree
Displays rule-based KPI messages and status indicators directly on Power BI report canvases.
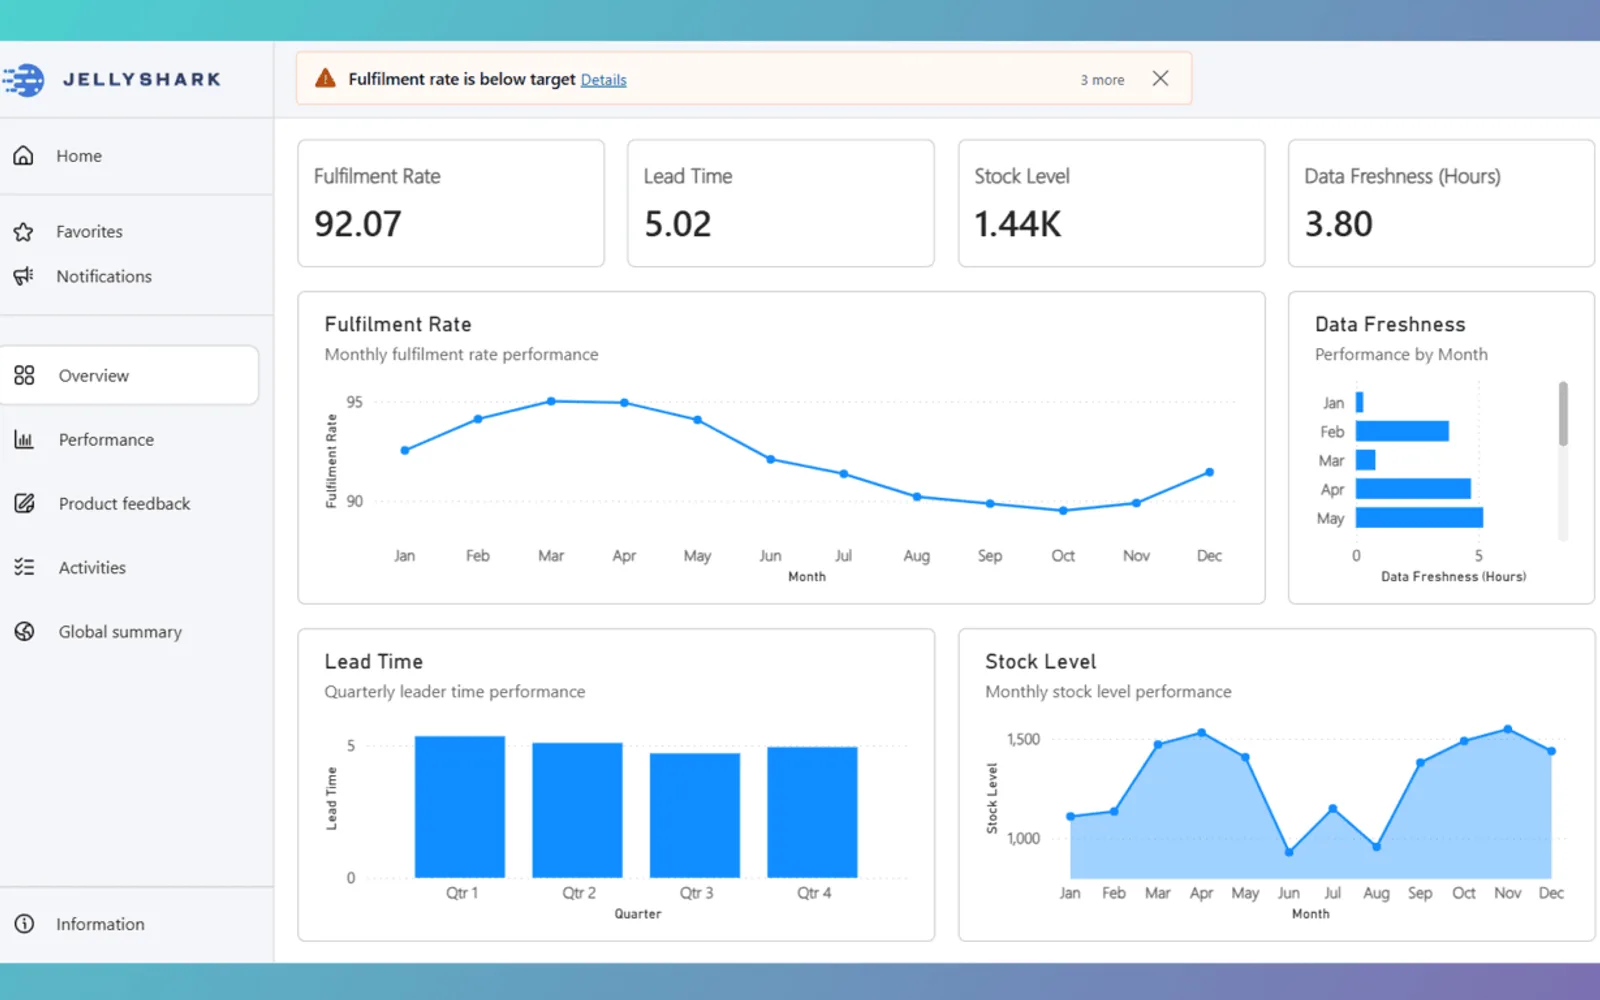
The visual displays messages on Power BI report canvases based on configurable rules. Each rule compares a KPI with a target or condition and shows custom text when triggered. Rules can include status levels, optional explanations, and messages that stack when multiple rules apply. Users can dismiss displayed messages, and a remaining-count indicator shows additional stacked messages.
Each visual supports up to eight independent rules.
Rules compare a KPI against a target or condition.
Rules can display Info, Success, Caution, or No Message states.
Each rule can include its own message text and an optional detailed explanation.
Messages stack when multiple rules apply and can show a remaining-count indicator.
Displayed messages can be dismissed by the user.
657 plugins in Power BI · Analytics
Price distribution: 73 free, 108 freemium, 441 paid, 35 price not published
Gantt Chart is a project management visual for Microsoft Power BI that tracks schedules, milestones, and resource workloads.
ChartPad
Creates visualizations from diverse chart types, combines multiple charts on one canvas, and adds custom annotations and tooltips.
Akvelon
Creates financial and business reports in Power BI with automatic variance calculations, P&L logic, and drill-down (s5, s6).
Zebra BI
AI analysis app for Dynamics 365 Business Central that provides customer KPIs, churn probability, and customer grouping.
Data Courage«The Message Bar visual adds a clear context layer to Power BI reports by displaying rule-based messages directly on the canvas. It helps users understand what the numbers mean without relying on extra pages, notes, or explanations. You can configure up to eight independent rules. Each rule compares a KPI against a …»