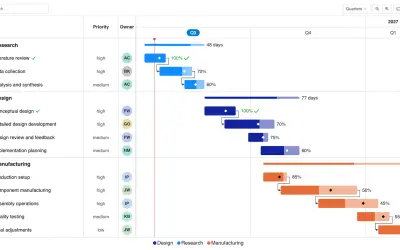
Gantt Chart
Gantt Chart is a project management visual for Microsoft Power BI that tracks schedules, milestones, and resource workloads.
ChartPadFree
Control comic characters, emotions, and poses from data in Power BI visuals.
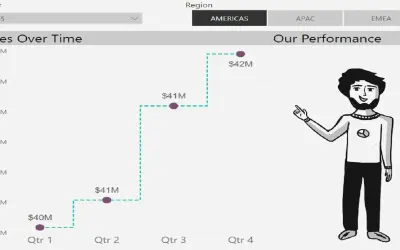
Controls comic characters, emotions, and poses from Power BI data. Displays up to two KPIs, each with an emotion, a pose, or both. Visual settings can keep the selected emotion or pose static. The visual supports Dee and Dey comics and can be used as a data-driven or static visualization.
Controls comic characters, emotions, and poses from data.
Displays up to two KPIs at a time.
Visualizes each KPI with an emotion, a pose, or both.
Keeps the selected emotion or pose static through visual settings.
Supports the Dee and Dey comic characters.
693 plugins in Power BI · Analytics
Price distribution: 73 free, 108 freemium, 471 paid, 41 price not published
Gantt Chart is a project management visual for Microsoft Power BI that tracks schedules, milestones, and resource workloads.
ChartPad
Creates visualizations from diverse chart types, combines multiple charts on one canvas, and adds custom annotations and tooltips.
Akvelon
Creates financial and business reports in Power BI with automatic variance calculations, P&L logic, and drill-down (s5, s6).
Zebra BI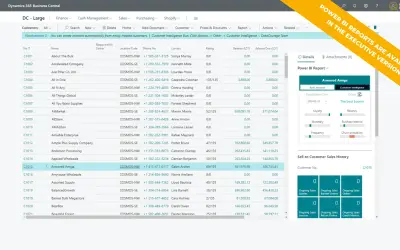
AI analysis app for Dynamics 365 Business Central that provides customer KPIs, churn probability, and customer grouping.
Data Courage«The Comicgen Power BI lets you control the characters, emotions, poses, etc from data. Happy people can accompany good news on charts. Users can show two or less KPI's at a time, Each can be visualized as emotion (e.g., happy or sad) and pose (e.g., Thumbs Up or Angry). You can choose to keep the visual emotion or …»