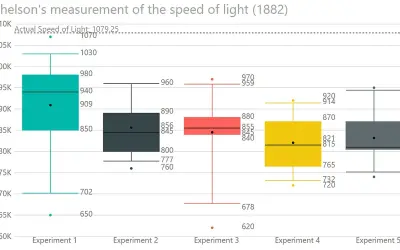
Box and Whisker chart
Displays the five-number summary of numerical datasets in Power BI, showing quartiles, median, mean, and whiskers.
DataScenariosPaid
Displays bullet charts in Power BI as an alternative to dashboard gauges and meters.
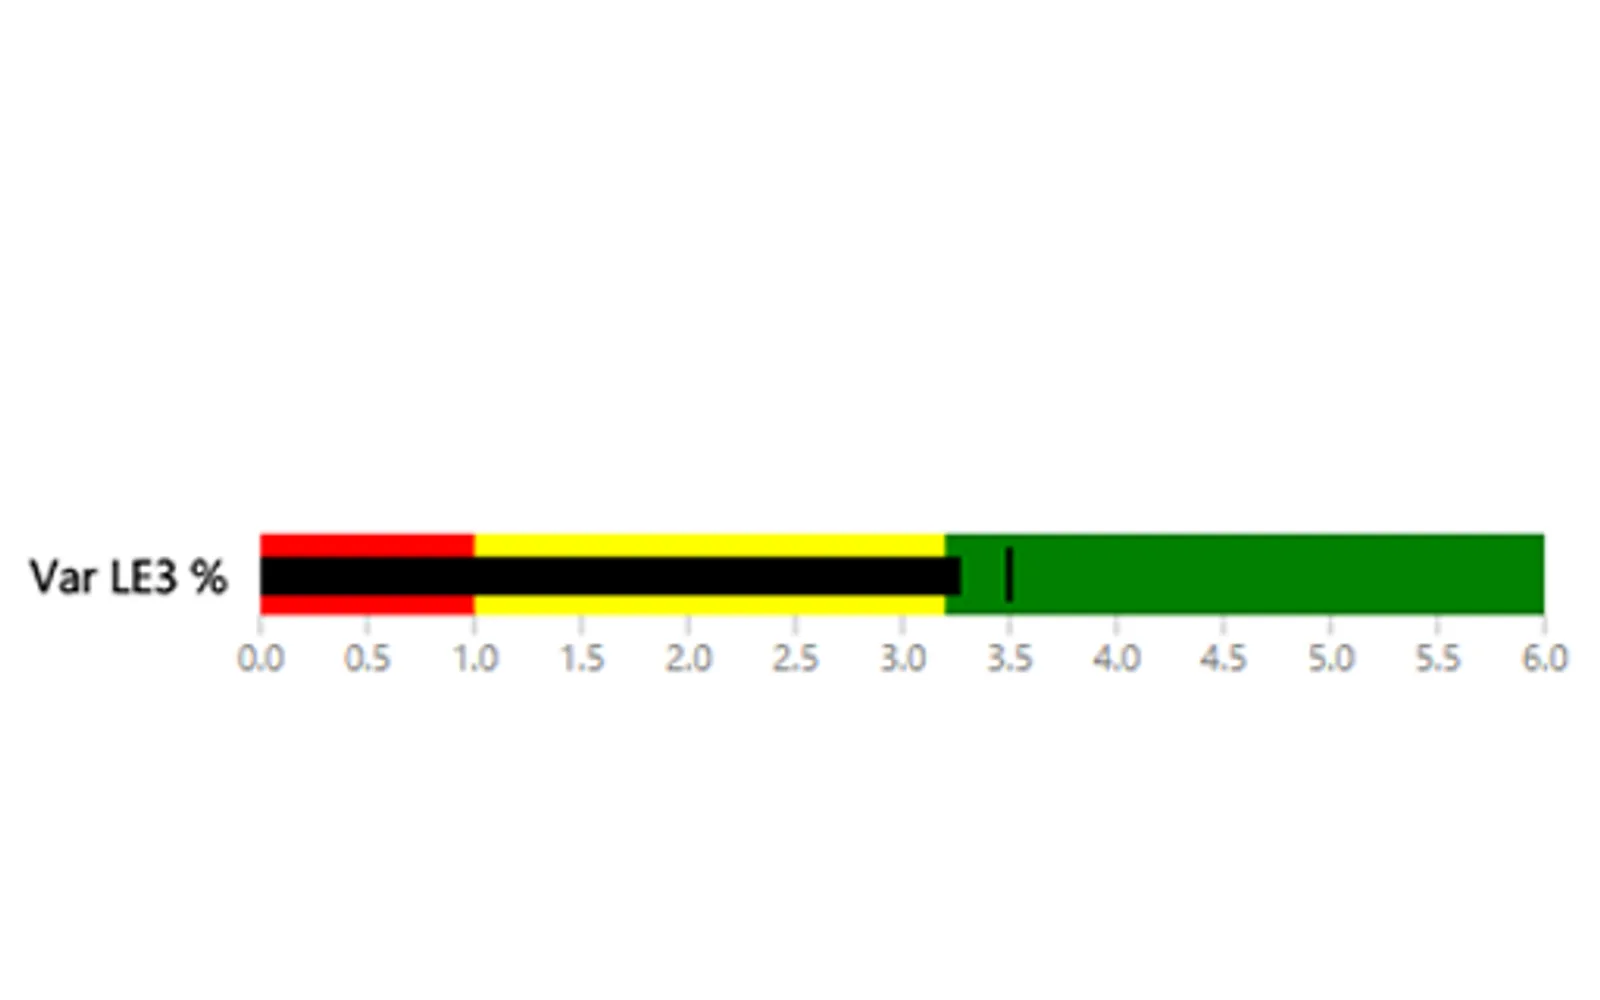
Displays a primary measure alongside a comparative measure and qualitative performance ranges. Bullet charts can use horizontal or vertical layouts and can be stacked for multiple measure comparisons. The chart includes a label, quantitative scale, featured measure, comparative measure, and qualitative scale.
Displays a featured measure such as current year-to-date revenue.
Compares the featured measure with another measure such as a target.
Shows performance ranges such as poor, satisfactory, and good.
Supports horizontal and vertical bullet chart orientations.
Allows several measures to be compared in a stacked chart.
Bullet Chart and Box and Whisker chart are both listed as paid cloud add-ins, while Bubble Chart by Akvelon is also listed as paid and cloud-based. Bullet Chart has an update date of Dec 2024, while Box and Whisker chart and Bubble Chart by Akvelon show Sep 2025.
| Name | Pricing | Deployment | Updated |
|---|---|---|---|
| this plugin | Paid | Cloud | |
| Box and Whisker chart | Paid | Cloud | |
| Bubble Chart by Akvelon | Paid | Cloud |
51 plugins in GitHub · Analytics
Price distribution: 1 free, 2 freemium, 42 paid, 6 price not published
Displays the five-number summary of numerical datasets in Power BI, showing quartiles, median, mean, and whiskers.
DataScenarios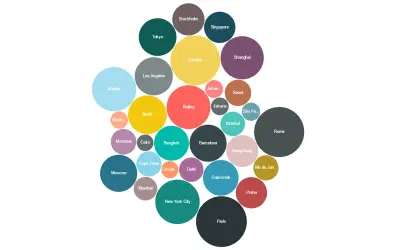
Bubble Chart by Akvelon is a Power BI visual that packs bubbles tightly to display more categories in a given space.
Akvelon
Gantt Chart is a project management visual for Microsoft Power BI that tracks schedules, milestones, and resource workloads.
ChartPad
Creates visualizations from diverse chart types, combines multiple charts on one canvas, and adds custom annotations and tooltips.
Akvelon«Bullet chart serves as a replacement for dashboard gauges and meters. Bullet charts were developed to overcome the fundamental issues of gauges and meters. The bullet chart features a single, primary measure (for example, current year-to-date revenue), compares that measure to one or more other measures to enrich its …»