Box and Whisker chart
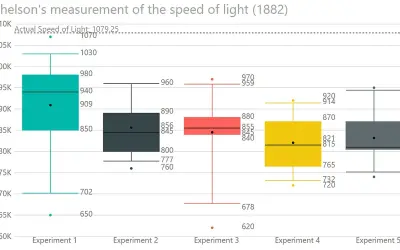
Displays the five-number summary of numerical datasets in Power BI, showing quartiles, median, mean, and whiskers.
DataScenariosPaidCompare
4 apps
Displays the five-number summary of numerical datasets in Power BI, showing quartiles, median, mean, and whiskers.
DataScenarios
D3.js Visual for Power BI provides a skeleton framework to build or adapt custom D3.js visuals within the Power BI environment.
DataScenarios