
Power Plot Visual by Akvelon
Creates visualizations from diverse chart types, combines multiple charts on one canvas, and adds custom annotations and tooltips.
AkvelonFreemium
Visualizes website visitor behavior with visitor records, heat maps, funnels, and client-side JavaScript error lists.
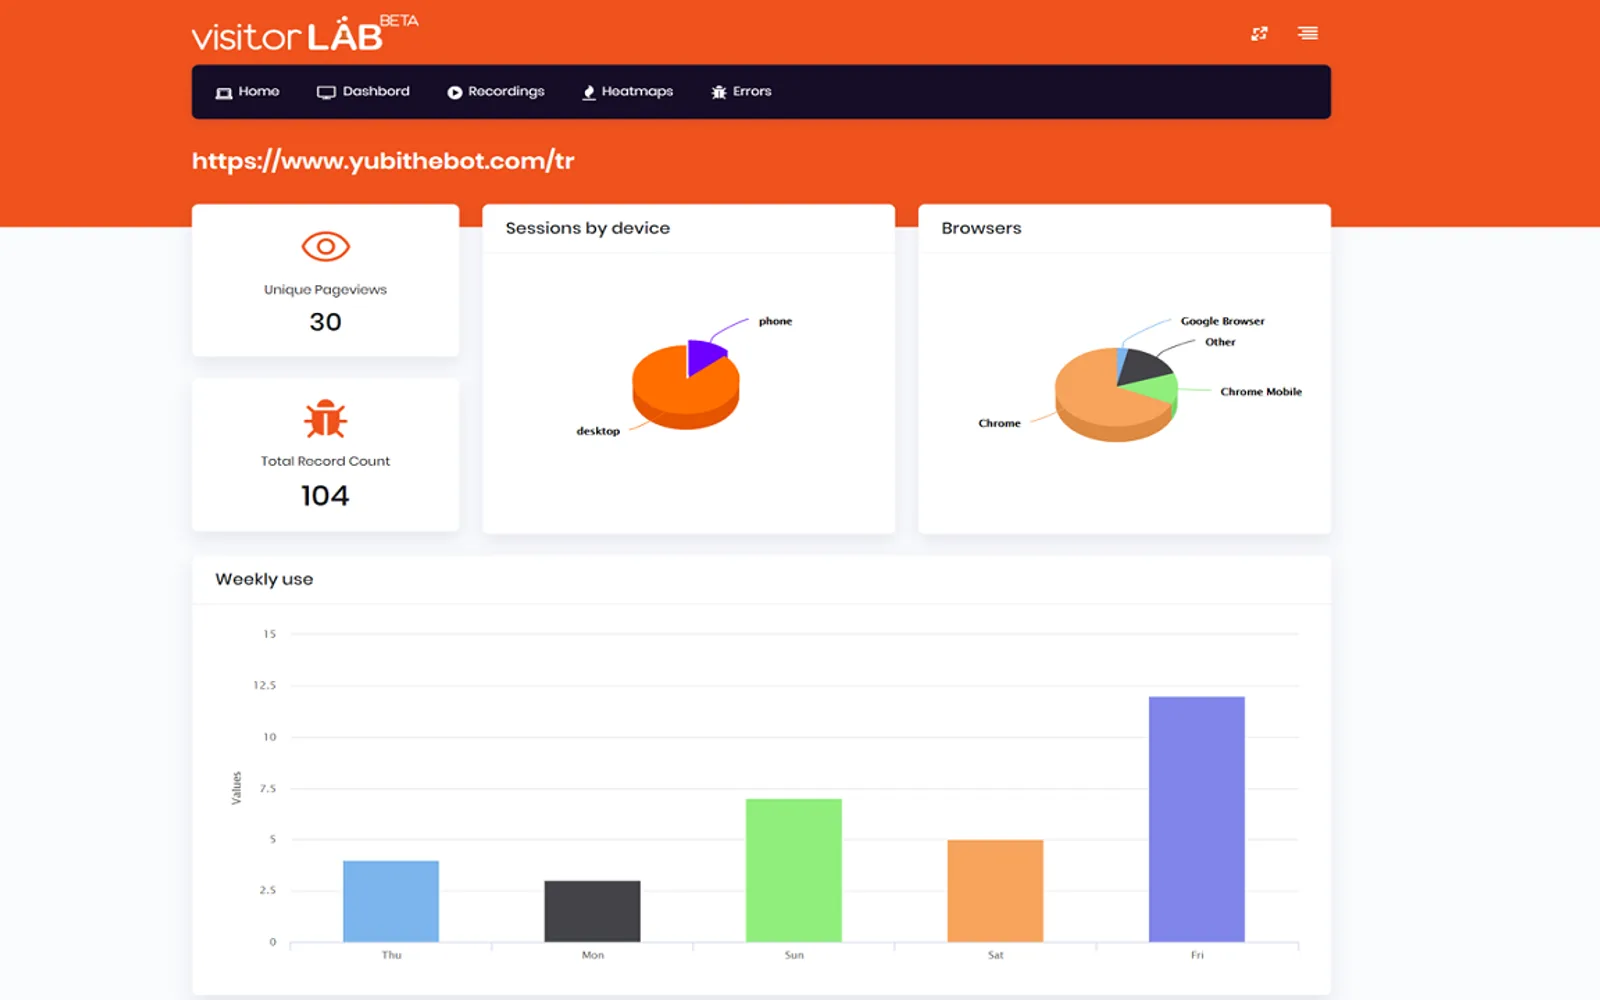
VisitorLAB provides visitor records showing website usage patterns and visitor behavior through videos. Heat maps analyze mouse movements, click rates, and page transitions. Funnel analysis shows visitor paths toward selected pages, including order screens or membership pages. It also lists client-side JavaScript errors occurring in browsers.
Shows visitor behavior and website usage patterns through visitor records and videos.
Analyzes mouse movements, click rates, and page transitions.
Lists client-side JavaScript errors occurring in browsers.
Shows visitor paths toward selected website pages.
Development teams.
2,531 plugins in Analytics
Price distribution: 125 free, 147 freemium, 1,350 paid, 909 price not published
Creates visualizations from diverse chart types, combines multiple charts on one canvas, and adds custom annotations and tooltips.
Akvelon
Creates financial and business reports in Power BI with automatic variance calculations, P&L logic, and drill-down (s5, s6).
Zebra BI
COSMO Text Module provides extended text management with a WYSIWYG editor for Microsoft Dynamics 365 Business Central.
COSMO CONSULT
Discover the why behind your data.
Data Courage«SeeWhat Your Visitors Sees Increase your website's interaction by starting to understand yourvisitors better. Step 1: Visualize visitors’ andinteractions on your website Step 2: Get meaningful insightsfrom data collected based on the visitor'sactions Step 3: Organize your websitebased on information from your …»