
Power Plot Visual by Akvelon
Creates visualizations from diverse chart types, combines multiple charts on one canvas, and adds custom annotations and tooltips.
AkvelonFreemium
Shows hourly marine conditions for surfing and boating, including waves, wind, tides, and safety notices.
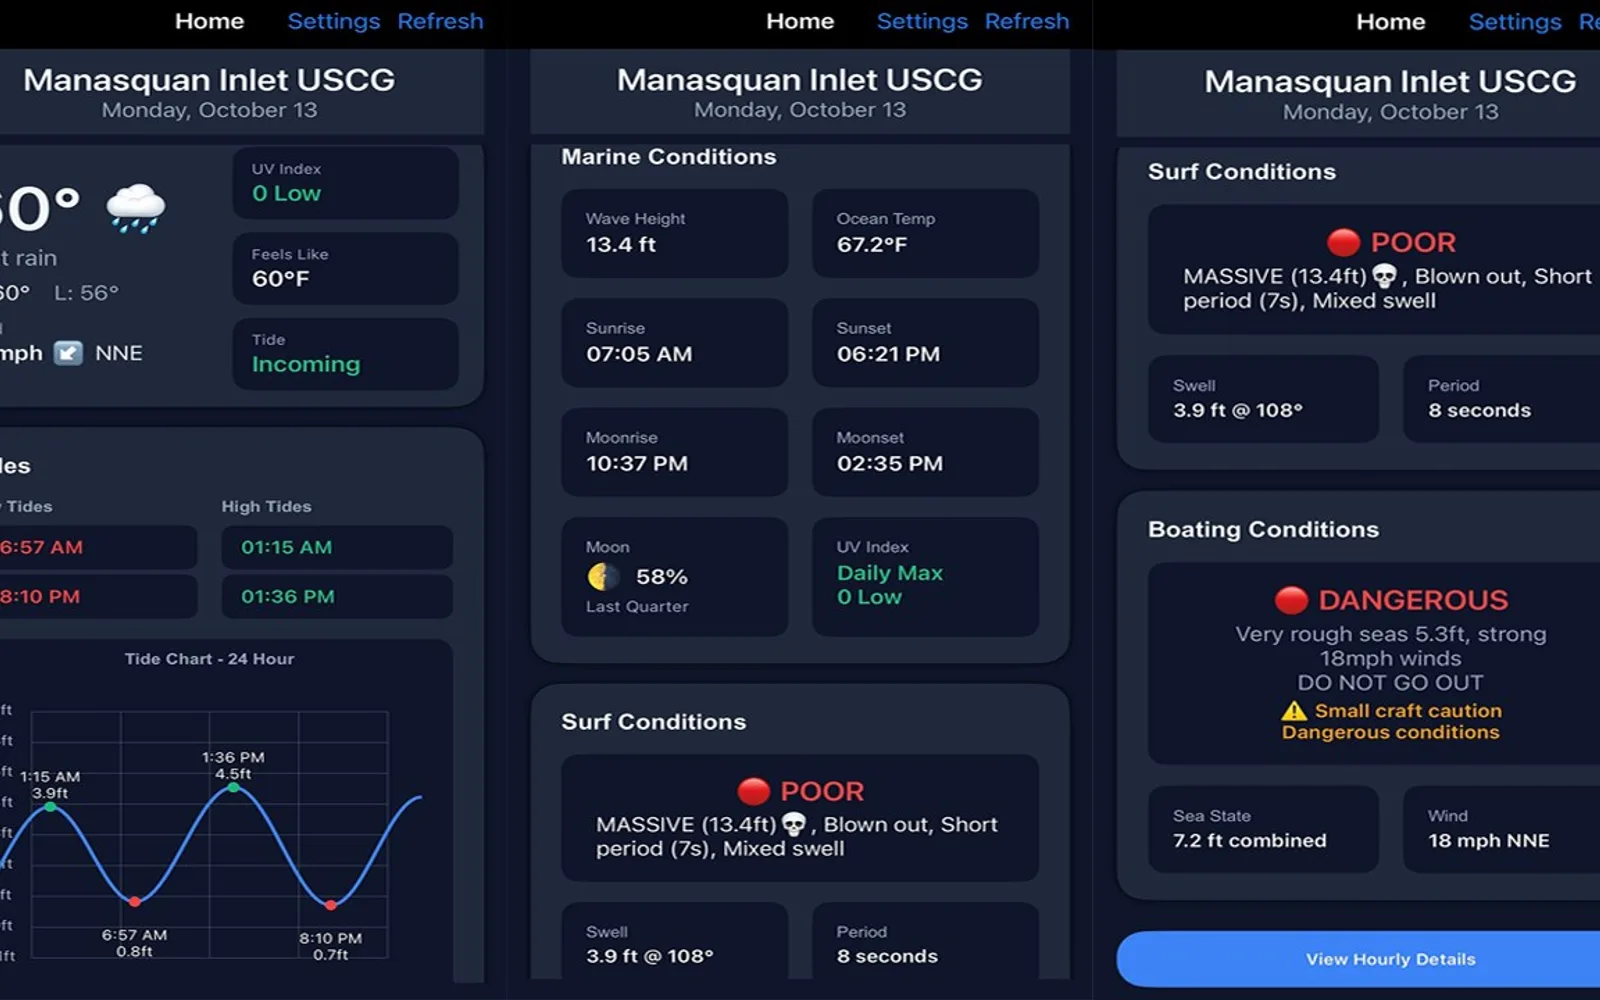
TideChart provides marine forecasts for surfers and boaters. Its forecast method combines wind, swell, wave, tide, and beach-orientation data to classify conditions. Hourly views present forecast measures for selected times. The listing also includes tide levels, ocean temperature, UV index, sunrise and sunset, and moon phases.
Displays warnings such as DANGEROUS and Small craft caution.
Breaks forecast information into individual hours.
Shows tide information across a 24-hour period.
Includes ocean temperature, UV index, sunrise and sunset times, and moon phases.
Processes wind speed and direction, swell direction and size, wave period and height, tide, and beach-facing direction.
TideChart is for surfers and boaters.
2,531 plugins in Analytics
Price distribution: 125 free, 147 freemium, 1,350 paid, 909 price not published
Creates visualizations from diverse chart types, combines multiple charts on one canvas, and adds custom annotations and tooltips.
Akvelon
Creates financial and business reports in Power BI with automatic variance calculations, P&L logic, and drill-down (s5, s6).
Zebra BI
COSMO Text Module provides extended text management with a WYSIWYG editor for Microsoft Dynamics 365 Business Central.
COSMO CONSULT
Discover the why behind your data.
Data Courage«Know Before You Go For surfers and boaters, timing is everything. Don't waste another trip to the shore only to find blown-out waves or treacherous conditions. TideChart is the essential marine forecasting tool designed to give you the most accurate and detailed picture of what's happening on the water, right now and …»