
Sprint Ops Center
Plan and track Jira sprints using views of team capacity, workload, utilization, availability, and velocity.
iSynergy TechSys Pvt. Ltd.Freemium
Displays Jira group workloads, including members with no assigned tasks, using charts, filters, and capacity thresholds.
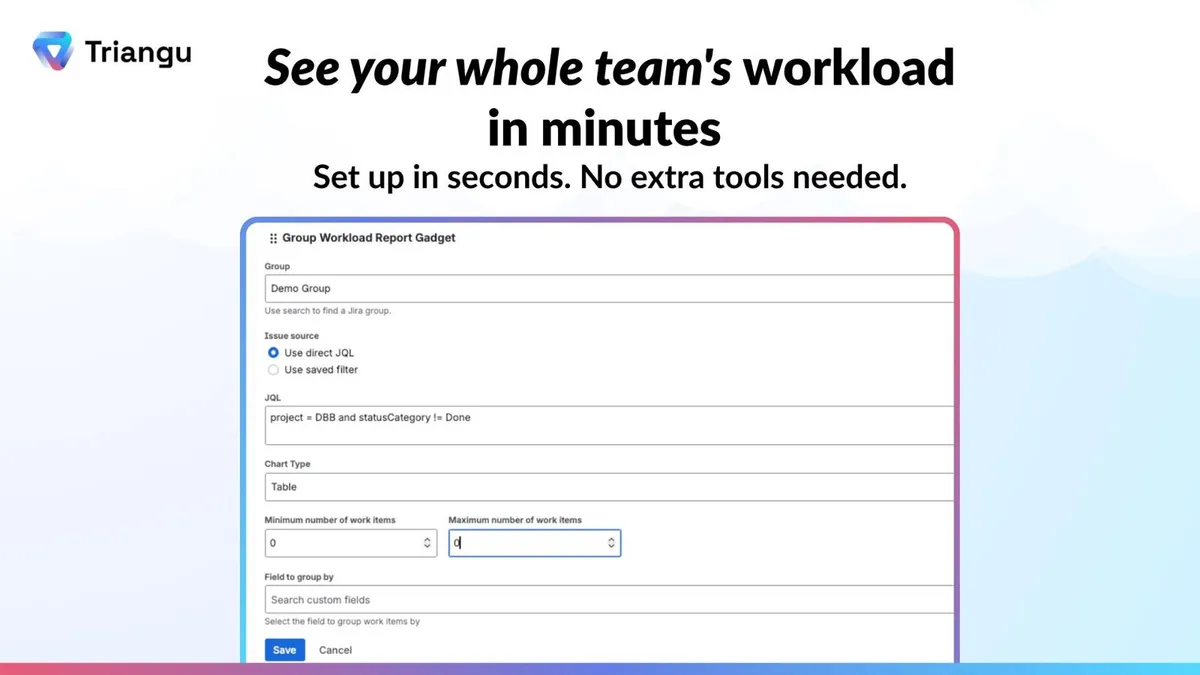
The gadget displays every member of a Jira group, including members with zero assigned tasks. It supports JQL queries and saved filters to define the issues included in the workload view. Workloads can appear as a table, bar chart, pie chart, or donut chart, and can be grouped by priority, issue type, project, or status. It runs as a standard gadget on Jira dashboards.
Shows all Jira group members, including those with zero assigned tasks.
Provides table, bar chart, pie chart, and donut chart formats.
Uses JQL queries and saved filters to define workload issues.
Supports minimum and maximum task thresholds for capacity filtering.
Groups tasks by priority, issue type, project, or status.
It is named for engineering managers, project managers, Scrum Masters, and team leads.
Team Workload Gadget is free and cloud-only, while Sprint Ops Center and Plugio Panels - Progress, Charts & Related Issues for Jira are freemium and cloud-only. Those alternatives were updated in Jul 2026 and Aug 2026, compared with Apr 2026 for Team Workload Gadget. Throughput Charts for Scrum, Kanban, SAFe (Gadgets Reports) is freemium and cloud-only.
| Name | Pricing | Deployment | Updated |
|---|---|---|---|
| this plugin | Free | Cloud | |
| Sprint Ops Center | Freemium | Cloud | |
| Plugio Panels - Progress, Charts & Related Issues for Jira | Freemium | Cloud | |
| Throughput Charts for Scrum, Kanban, SAFe (Gadgets Reports) | Freemium | Cloud |
630 plugins in Jira · Data and analytics
Price distribution: 189 free, 230 freemium, 211 paid
Plan and track Jira sprints using views of team capacity, workload, utilization, availability, and velocity.
iSynergy TechSys Pvt. Ltd.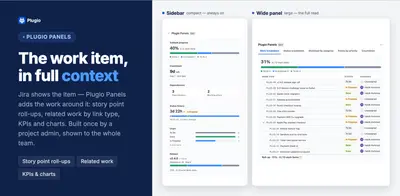
Adds roll-ups, progress views, KPIs, charts and related-issue panels to Jira work items.
Plugio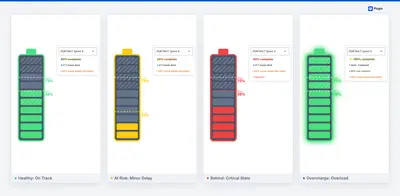
Track Jira sprint pace with a battery-style dashboard for health, scope changes, and issue breakdowns.
Plugio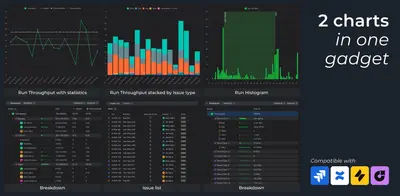
Creates throughput run and histogram charts in Jira dashboards from Scrum, Kanban, SAFe, project, release, epic, and JQL data.
Broken Build«Shows all Jira group members including those with zero assigned tasks Four chart types: Table, Bar Chart, Pie Chart, Donut Chart JQL query support and saved filter integration Minimum and maximum task thresholds for capacity filtering Group by priority, issue type, or project Works on any Jira dashboard as a standard …»