
Power Plot Visual by Akvelon
Creates visualizations from diverse chart types, combines multiple charts on one canvas, and adds custom annotations and tooltips.
AkvelonFreemium
Task analytics for TASKER across workspaces, users, task types, activity, duration, priorities, and resolution times.
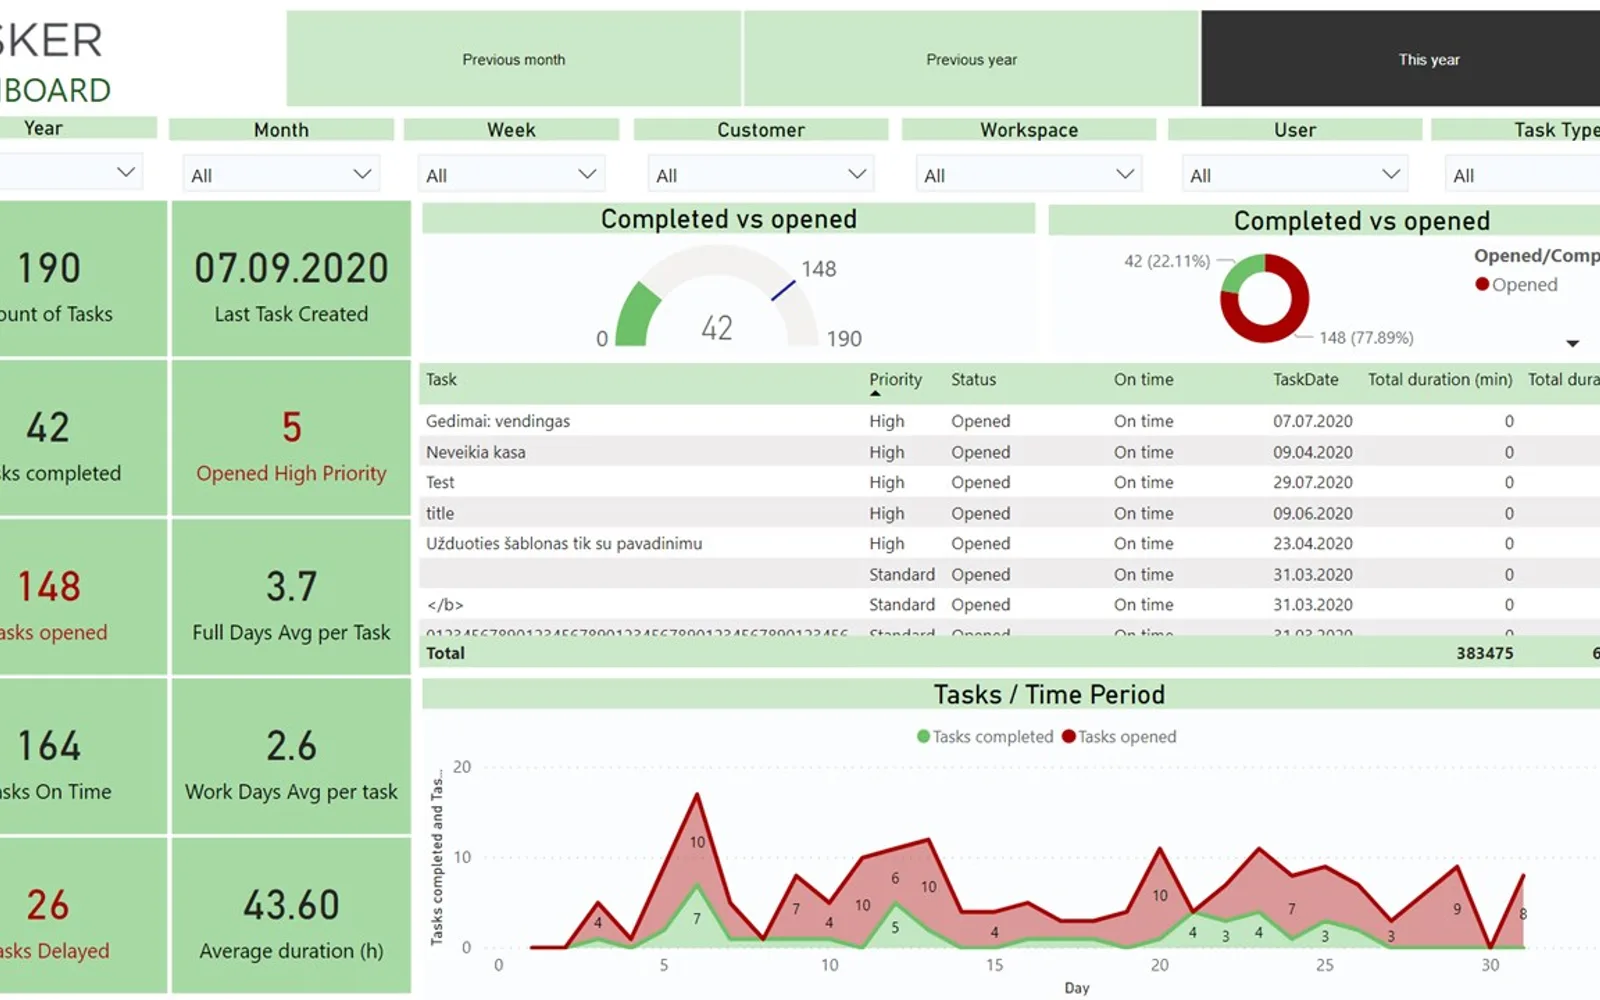
Analyzes current and past TASKER activity across workspaces, users, and task types. It reports KPIs such as completed and opened task totals, average resolution time, and delayed task counts. Analysis sections cover task duration, user results, task priority handling, and dashboard views. Ad hoc analysis can filter task resolution results across periods including today, yesterday, weeks, months, and years.
Analyzes current and past activity using KPIs such as completed and opened task totals.
Reports average task resolution time and counts of delayed tasks.
Provides analysis of task management results by users.
Provides analysis of task priority handling.
Supports analysis by different criteria across time dimensions including days, weeks, months, and years.
2,531 plugins in TASKER · Analytics
Price distribution: 125 free, 147 freemium, 1,350 paid, 909 price not published
Creates visualizations from diverse chart types, combines multiple charts on one canvas, and adds custom annotations and tooltips.
Akvelon
Creates financial and business reports in Power BI with automatic variance calculations, P&L logic, and drill-down (s5, s6).
Zebra BI
COSMO Text Module provides extended text management with a WYSIWYG editor for Microsoft Dynamics 365 Business Central.
COSMO CONSULT
Discover the why behind your data.
Data Courage«This application allows you to get a clear picture about the current state of task resolution across different dimensions like workspaces (objects), users and task types. With the help of the application you may: • analyze current and past activity by using different key performance indicators (KPI), including the …»