
Power Plot Visual by Akvelon
Creates visualizations from diverse chart types, combines multiple charts on one canvas, and adds custom annotations and tooltips.
AkvelonFreemium
Generate task charts in SharePoint for statuses, priorities, assignees, and status or priority counts by user.
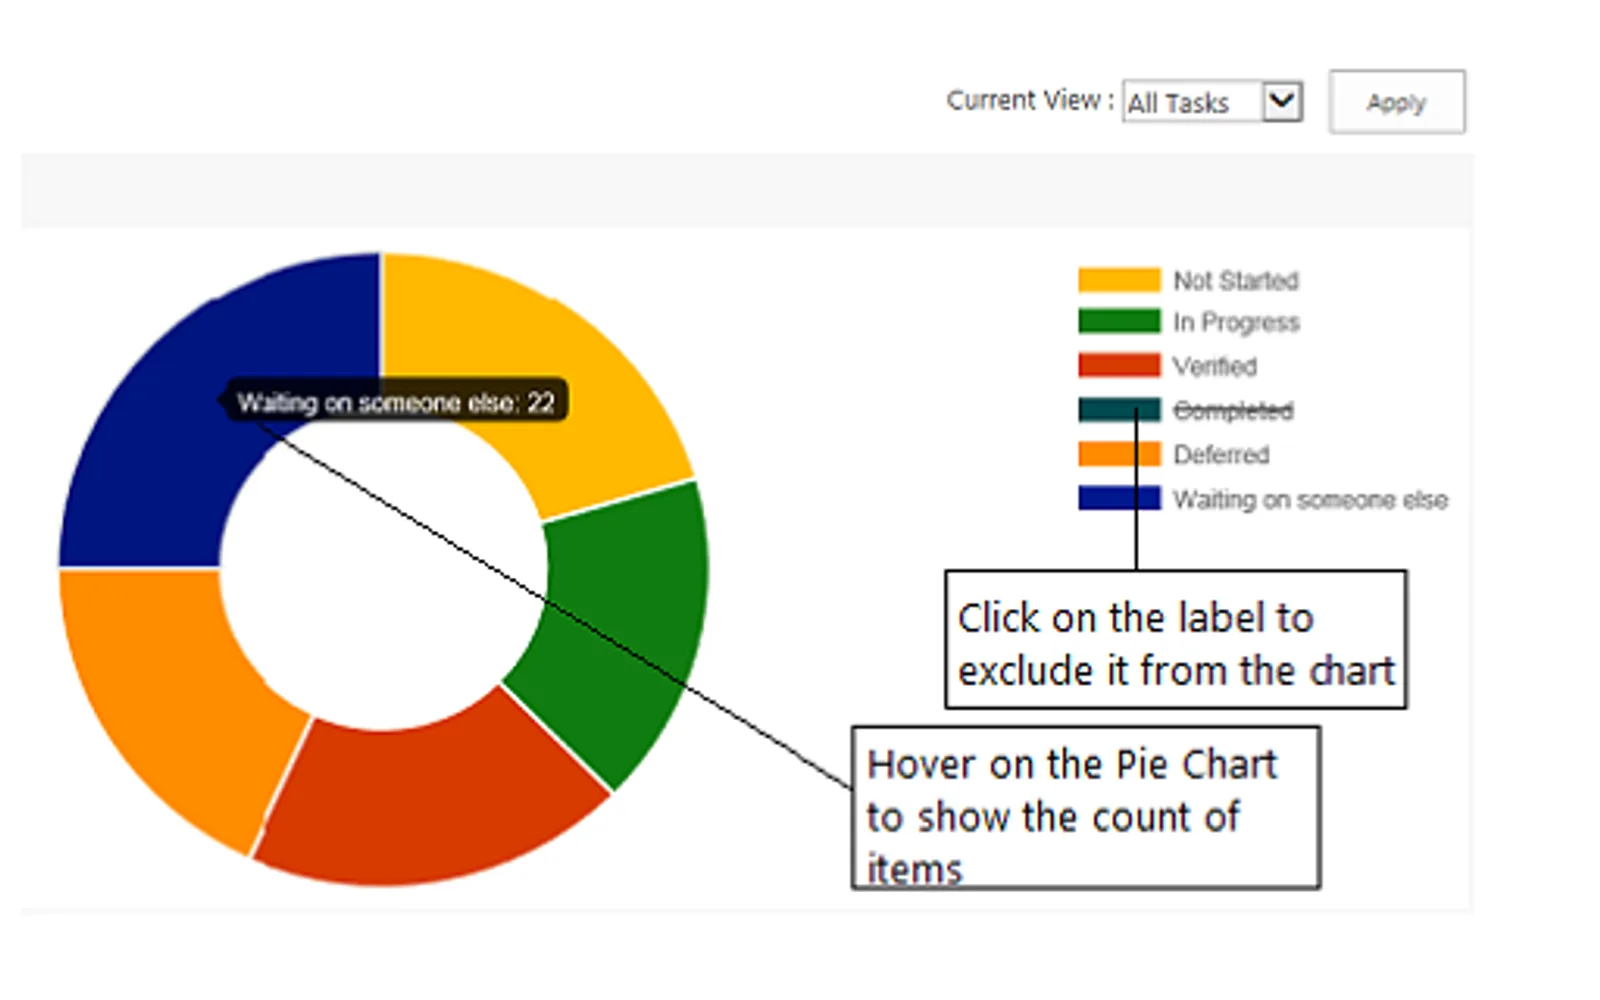
Adds a ribbon button to SharePoint lists of type List and opens a reports page for the selected list. The page includes pie charts for task statuses and priorities, a bar chart for tasks assigned to users, and a polar chart showing status or priority counts by user. Reports can be filtered to all tasks, completed tasks, late tasks, or upcoming tasks. Chart labels can be clicked to exclude statuses, priorities, or users from selected reports.
Displays the number of tasks for each status in a pie chart.
Displays the number of tasks for each priority in a pie chart.
Displays the number of tasks assigned to each user in a bar chart.
Displays task status or priority counts for each user in a polar chart.
Reports can be viewed for all tasks, completed tasks, late tasks, or upcoming tasks.
2,531 plugins in Analytics
Price distribution: 125 free, 147 freemium, 1,350 paid, 909 price not published
Creates visualizations from diverse chart types, combines multiple charts on one canvas, and adds custom annotations and tooltips.
Akvelon
Creates financial and business reports in Power BI with automatic variance calculations, P&L logic, and drill-down (s5, s6).
Zebra BI
COSMO Text Module provides extended text management with a WYSIWYG editor for Microsoft Dynamics 365 Business Central.
COSMO CONSULT
Discover the why behind your data.
Data Courage«Generate charts for the Statuses, Priorities, No. of Tasks assigned to users by analysing the items from Tasks list. A ribbon button will be available within all lists of type List, which will open a reports page for that list. This page shows Pie Charts, Bar Charts for the following reports - Status Report : This …»