AtlassianET
Estimation Tracker
Track Jira estimates, workload distribution, trends, and story points through project dashboards.
Estimation TrackerPaid
Track Jira ticket value, estimates, logged time, work status, costs, and capacity signals.
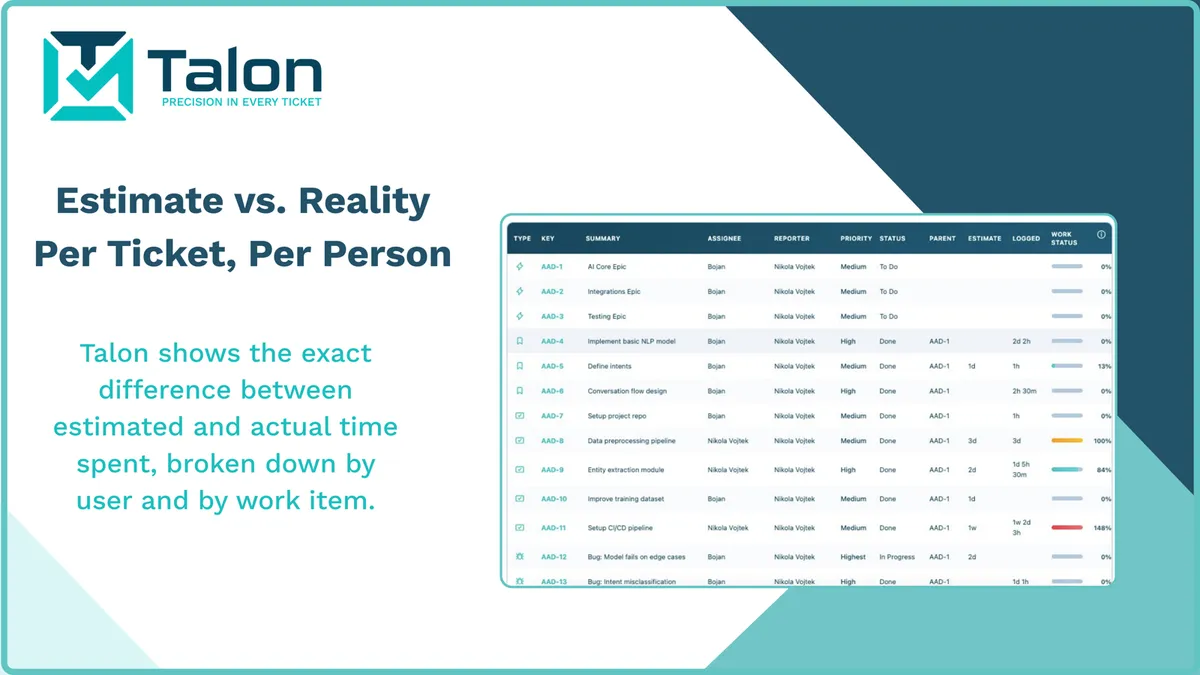
Talon lets users enter a ticket’s Gross Expected Value in Jira. It visualizes tickets and costs in a Weekly Delivery Dashboard. Users can search a project for a specific range of tickets and view Original Estimate, Logged Time, and the percentage of work logged against the estimate. The add-in compares estimated and actual time by user and work item, and presents logged time and workload as capacity signals.
Users can enter a ticket’s Gross Expected Value.
The Weekly Delivery Dashboard visualizes tickets and costs.
Users can search a project for a specific range of tickets.
Talon compares estimated and actual time by user and work item.
Logged time and workload are presented as capacity signals.
Talon is for managers and teams.
Talon is freemium and cloud-based, while Estimation Tracker and Focus Flow are paid and cloud-based. Talon was updated in Jan 2026, compared with Feb 2026 for Estimation Tracker and Jun 2026 for Focus Flow. Tracking & Estimation for Jira is paid and supports data-center, cloud, and server deployment.
| Name | Pricing | Deployment | Updated |
|---|---|---|---|
| this plugin | Freemium | Cloud | |
| Estimation Tracker | Paid | Cloud | |
| Focus Flow | Paid | Cloud | |
| Tracking & Estimation for Jira | Paid | Cloud · Data Center · Server |
1,328 plugins in Jira · Data and analytics
Price distribution: 444 free, 418 freemium, 466 paid
Track Jira estimates, workload distribution, trends, and story points through project dashboards.
Estimation Tracker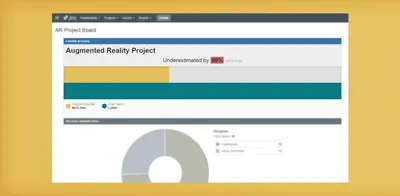
Jira dashboard gadget that compares estimated hours with logged time for JQL-selected issues.
Heckr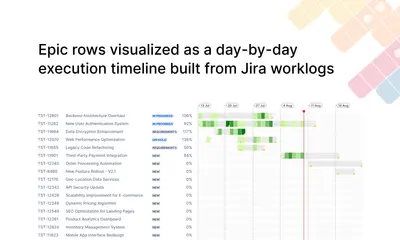
Maps Jira worklogs onto an epic timeline to compare planned and actual activity during weekly reviews.
Memcrab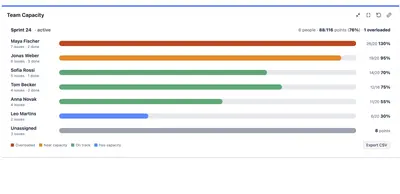
Plan Jira sprint capacity with a dashboard heatmap showing each person's workload against capacity.
Janek Behrens«It provides the ability for the user to enter the ticket’s Gross Expected Value, and Talon handles the rest. It also visualize tickets and costs using the Weekly Delivery Dashboard and provides a user the ability to search specific range of tickets in a project to instantly view Original Estimate, Logged Time, and % …»