
Agile Charts & Gadgets: Reports, Graphs, KPIs on Dashboard
Analyze Jira delivery, sprint, flow, forecasting, and cycle-time data with reports and dashboard gadgets.
Broken BuildPaid
Analyze Jira workflow records to forecast throughput and capacity, measure flow efficiency, and examine incoming demand.
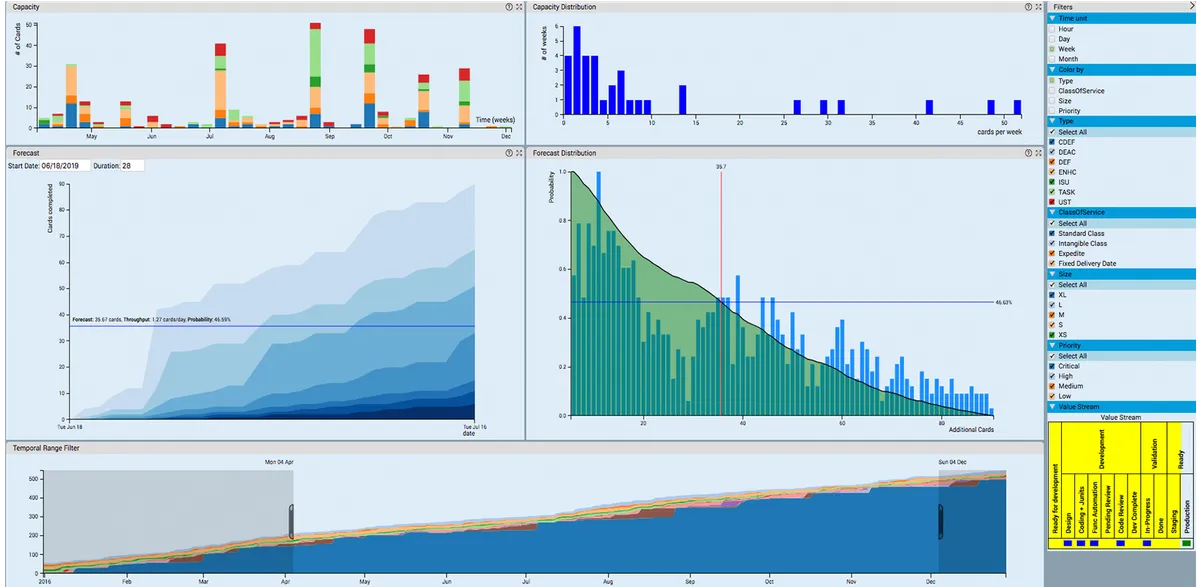
Swiftly analyzes workflow information from Jira and other work management, ticketing, and custom workflow applications. Its analytics support interactive exploration of workflow data. The tool estimates possible team throughput at different probability levels and displays available capacity for additional work. It also measures time spent on work items and reports incoming Kanban demand by volume and work type over time.
Forecasts the quantity of work teams may finish across different probability levels.
Displays the system's capacity for accepting additional work over time.
Measures the time spent on individual work items.
Reports the volume and categories of work entering a Kanban board's Ready column at different timestamps.
Swiftly is for teams using Jira, ServiceNow, ticketing applications, or custom workflow applications.
630 plugins in Jira · Data and analytics
Price distribution: 189 free, 230 freemium, 211 paid
Analyze Jira delivery, sprint, flow, forecasting, and cycle-time data with reports and dashboard gadgets.
Broken Build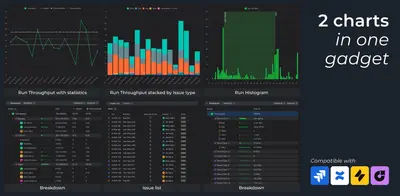
Creates throughput run and histogram charts in Jira dashboards from Scrum, Kanban, SAFe, project, release, epic, and JQL data.
Broken Build
Create throughput charts in Jira from boards, projects, releases, epics, SAFe data, or JQL.
Broken Build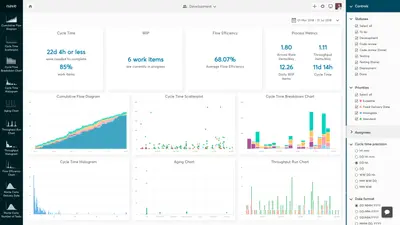
Analyze Jira workflows with cycle-time, throughput, flow-efficiency, forecasting, and due-date charts.
Nave«Swiftly is an easy to use, powerful Workflow Analytics and Benchmarking tool that gives you powerful insights from data that is locked up in work management applications like JIRA, ServiceNow and other ticketing and custom workflow applications. The traditional reports that these applications provide are grossly …»