
Power Plot Visual by Akvelon
Creates visualizations from diverse chart types, combines multiple charts on one canvas, and adds custom annotations and tooltips.
AkvelonFreemium
Monitors infrastructure health and provides real-time observability across applications and infrastructure.
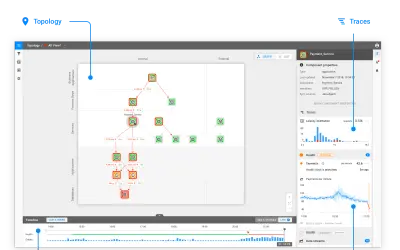
Provides a consolidated view of infrastructure health for IT Operations. Offers real-time observability across applications and infrastructure for DevOps. Shows correlations between software improvements and business results.
Provides a consolidated view for monitoring infrastructure health.
Provides real-time observability across applications and infrastructure.
Automatically detects issues and shows what can be done about them.
Shows the correlation between software improvements and business results.
IT Operations, DevOps, and business teams.
2,531 plugins in Analytics
Price distribution: 125 free, 147 freemium, 1,350 paid, 909 price not published
Creates visualizations from diverse chart types, combines multiple charts on one canvas, and adds custom annotations and tooltips.
Akvelon
Creates financial and business reports in Power BI with automatic variance calculations, P&L logic, and drill-down (s5, s6).
Zebra BI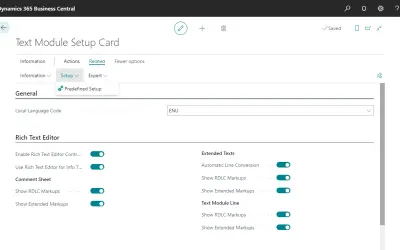
COSMO Text Module provides extended text management with a WYSIWYG editor for Microsoft Dynamics 365 Business Central.
COSMO CONSULT
Discover the why behind your data.
Data Courage«IT Operations Get everything you need in one view to monitor infrastructure health with zero blind spots. Predict failures and react to problems fast for efficient IT Operations. Reactive or proactive, we have you covered. DevOps Gain real-time observability across applications and infrastructure to improve speed …»