
Power Plot Visual by Akvelon
Creates visualizations from diverse chart types, combines multiple charts on one canvas, and adds custom annotations and tooltips.
AkvelonFreemium
Report incidents to a company through the Speeki reporting portal.
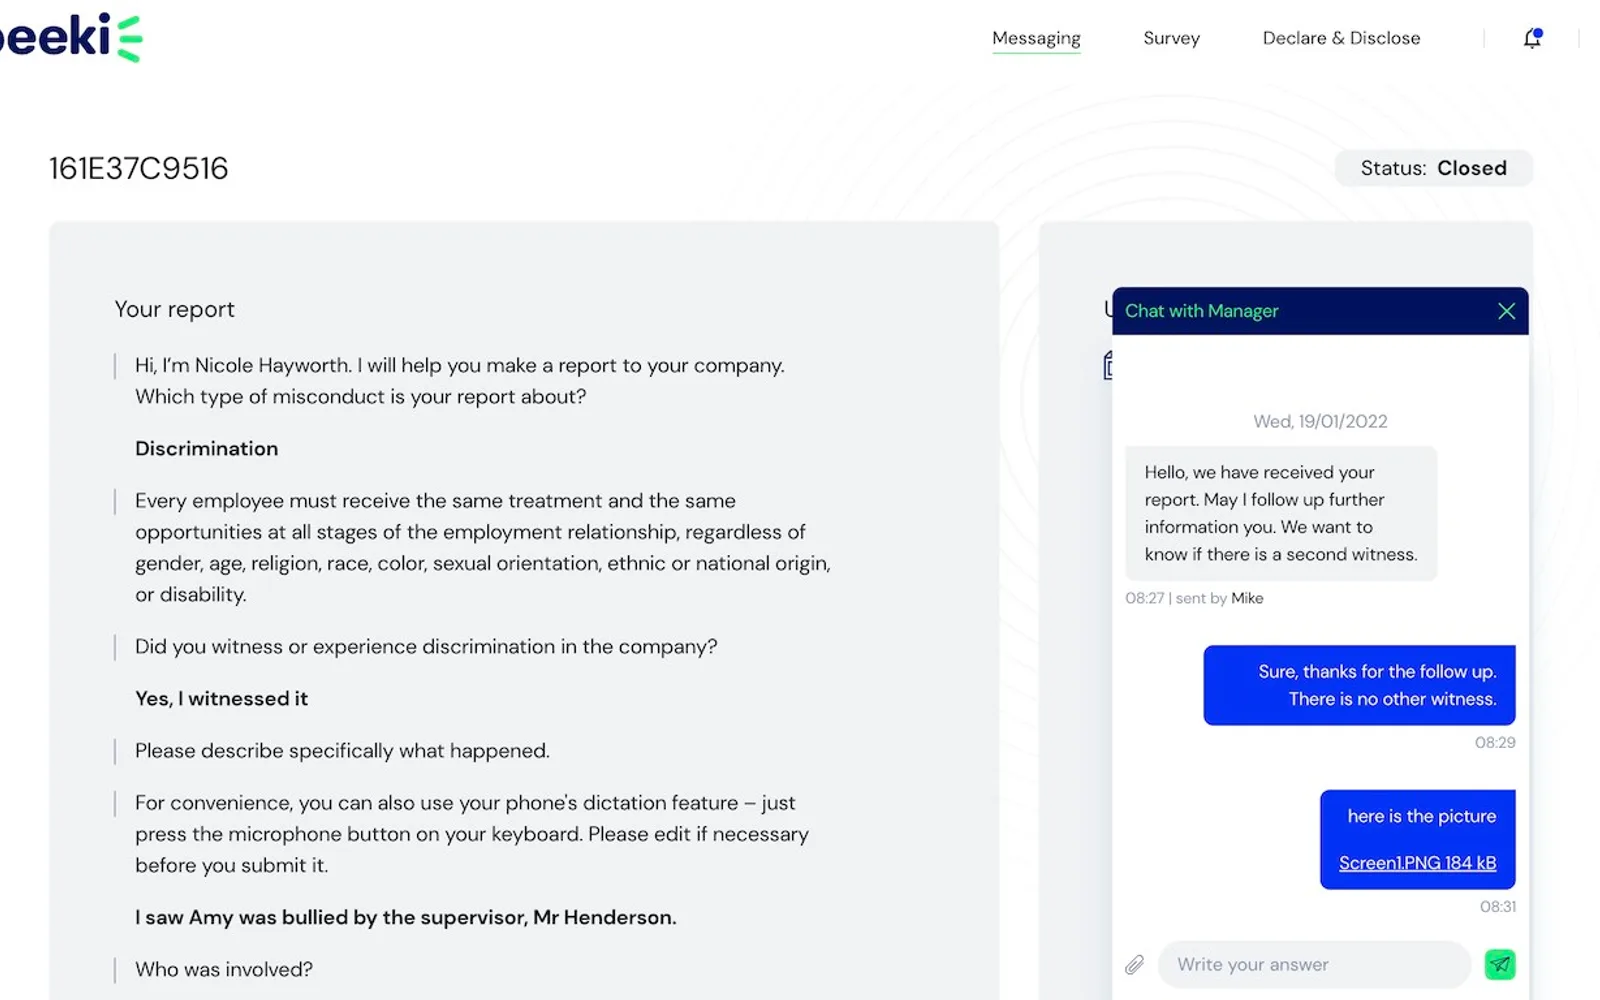
Lets users enter a company name and open that company’s website to view program information. Reports can be submitted as a guest or through an account, with the country, incident type, optional contact details, answers to chatbot questions, and supporting evidence. Users can check report status and send additional information after submission.
Users enter an entity name and are redirected to the company’s website.
Users can submit a report without creating an account.
Users can create an account to associate reports with their account and view multiple reports and updates.
Users can check report status and send additional information after logging in.
2,531 plugins in Analytics
Price distribution: 125 free, 147 freemium, 1,350 paid, 909 price not published
Creates visualizations from diverse chart types, combines multiple charts on one canvas, and adds custom annotations and tooltips.
Akvelon
Creates financial and business reports in Power BI with automatic variance calculations, P&L logic, and drill-down (s5, s6).
Zebra BI
COSMO Text Module provides extended text management with a WYSIWYG editor for Microsoft Dynamics 365 Business Central.
COSMO CONSULT
Discover the why behind your data.
Data Courage«You can use this app if your company is a Speeki customer. Please contact us at support@speeki.com with any questions. Start by entering the name of the company in the 'entity name' field you would like to speak with, and you will be redirected to the company's website. On the company page, you will find information …»