
Power Plot Visual by Akvelon
Creates visualizations from diverse chart types, combines multiple charts on one canvas, and adds custom annotations and tooltips.
AkvelonFreemium
Reports workplace incidents, hazards, close calls, and suggestions through a cloud-based web and mobile application.
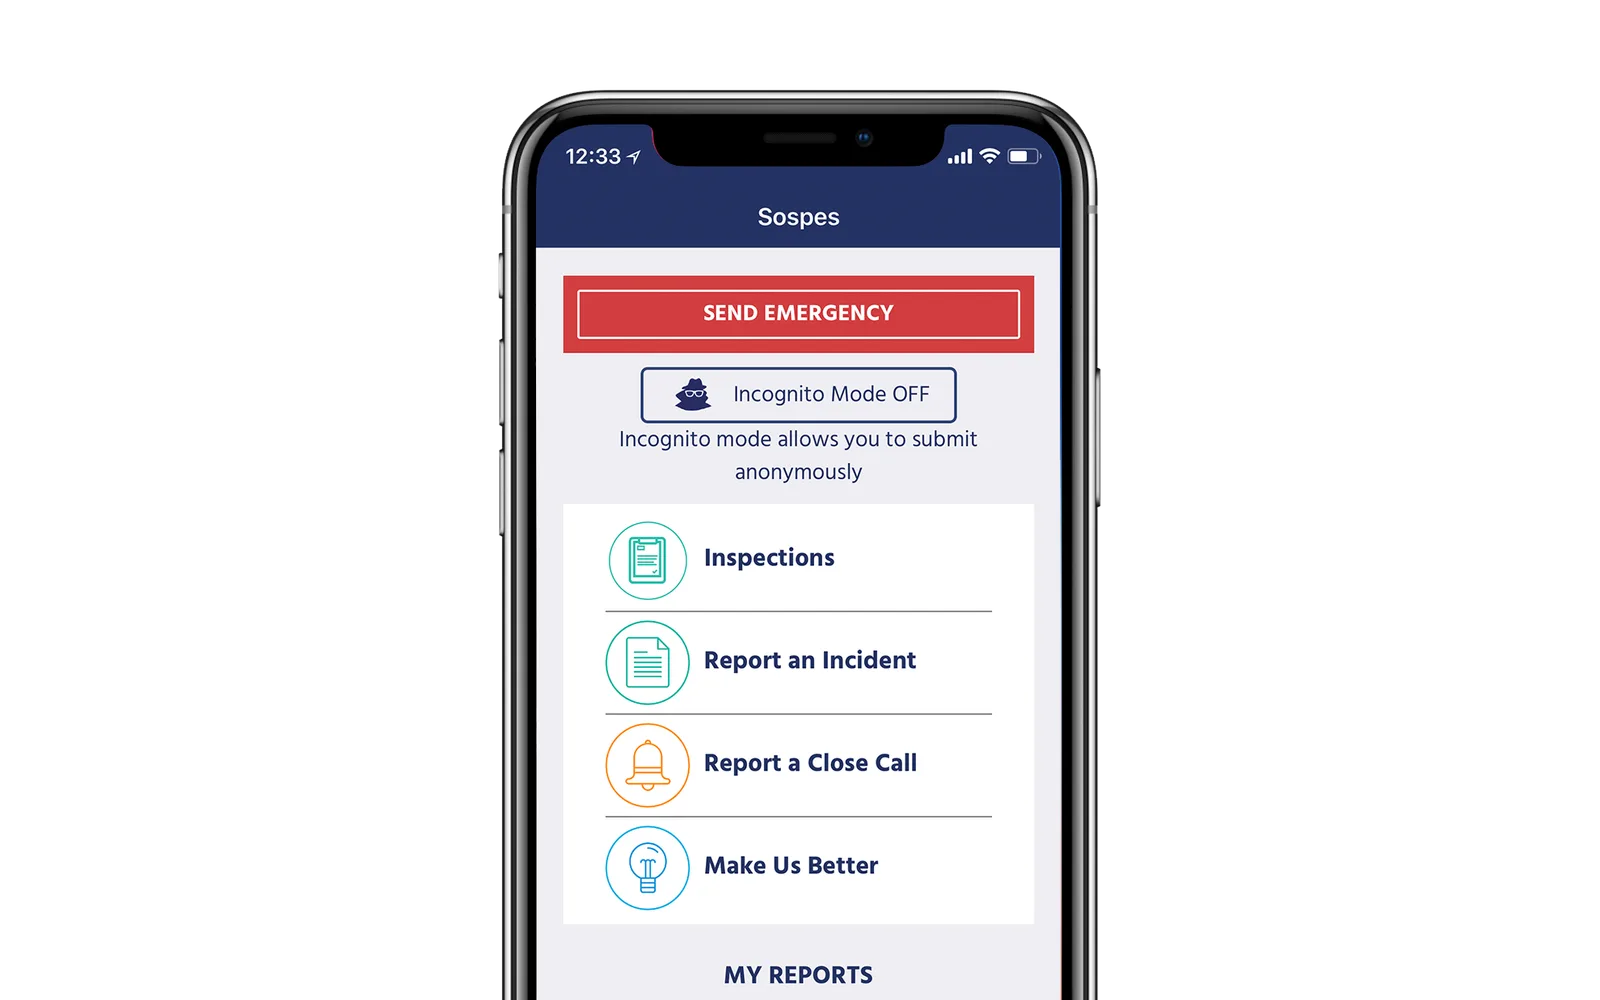
Workers can report injuries, property damage, environmental hazards, security threats, close calls, and suggestions through the web or mobile application. Reports may be anonymous and are transmitted to supervisors and safety professionals. The system supports event evaluation, root cause investigations, preventative actions, and management and OSHA-related regulatory reporting.
Workers can report injuries, property damage, environmental hazards, security threats, close calls, and suggestions.
Workers can submit reports anonymously.
Reported events can be evaluated for risk potential.
Root cause investigations can be launched and documented.
Preventative actions can be evaluated and implemented.
The system generates management reports and regulatory reports such as those required for OSHA.
Supervisors and safety professionals.
2,531 plugins in Analytics
Price distribution: 125 free, 147 freemium, 1,350 paid, 909 price not published
Creates visualizations from diverse chart types, combines multiple charts on one canvas, and adds custom annotations and tooltips.
Akvelon
Creates financial and business reports in Power BI with automatic variance calculations, P&L logic, and drill-down (s5, s6).
Zebra BI
COSMO Text Module provides extended text management with a WYSIWYG editor for Microsoft Dynamics 365 Business Central.
COSMO CONSULT
Discover the why behind your data.
Data Courage«Sospes provides Software-as-a-Service solutions that support worker safety through engagement. Our cloud-based web and mobile application allows workers to directly report workplace incidents involving injuries, property damage, environmental hazards and security threats; close calls; or even just make suggestions …»