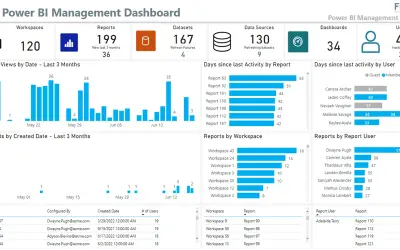
Power BI Service Management Report
Identifies unused licenses, reports, and workspaces in the Power BI service and tracks report usage, activity, and refreshes.
Flock ConsultingPaid
Analyze Smartsheet work activity in Power BI, including workspaces, sheets, reports, collaborators, and updates.
The Smartsheet app for Power BI provides information about a Smartsheet environment. It reports the number of workspaces, sheets, and reports, and identifies top collaborators and creators. It shows when sheets were modified or updated and identifies trends in Smartsheet collaboration activity.
Reports the number of workspaces, sheets, and reports in a Smartsheet environment.
Identifies top collaborators and creators in Smartsheet.
Shows when sheets were modified or updated.
Identifies trends in how an organization uses Smartsheet to collaborate on work.
657 plugins in Power BI · Analytics
Price distribution: 73 free, 108 freemium, 441 paid, 35 price not published
Identifies unused licenses, reports, and workspaces in the Power BI service and tracks report usage, activity, and refreshes.
Flock Consulting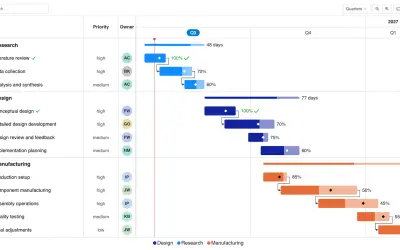
Gantt Chart is a project management visual for Microsoft Power BI that tracks schedules, milestones, and resource workloads.
ChartPad
Creates visualizations from diverse chart types, combines multiple charts on one canvas, and adds custom annotations and tooltips.
Akvelon
Creates financial and business reports in Power BI with automatic variance calculations, P&L logic, and drill-down (s5, s6).
Zebra BI«Get insights into your work with the Smartsheet app for Power BI. This app gives you a comprehensive view into your Smartsheet environment, including how many workspaces, sheets and reports you have, who your top collaborators and creators are, when your sheets have been modified or updated, and identify key trends …»