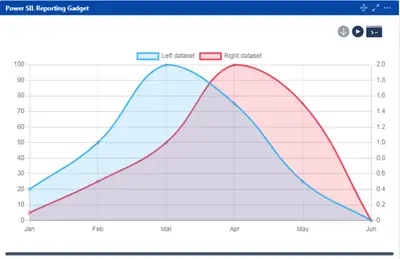
Power Dashboards, Reports & Gadgets
Create Jira reports, dashboards and visualizations using SIL, HTML, CSS and JavaScript.
AppfirePaid
Create customizable charts, reports, dashboards and analytics from Jira data.
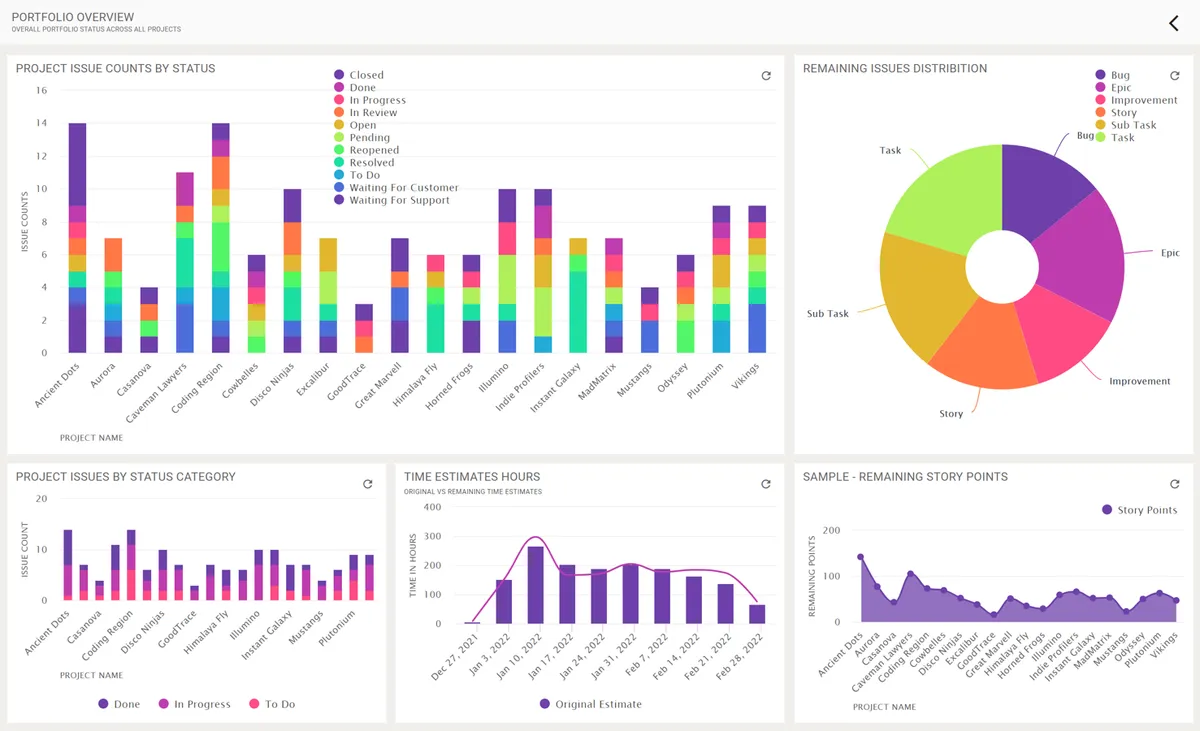
Smart Boards connects to Jira data using JQL and presents it through charts, graphs, reports and dashboards. Charting tools support different data visualizations, while the dashboard designer allows layout changes and drag-and-drop configuration. A library provides central access to data sources, widgets and dashboards. Individual dashboard elements can be styled with custom color schemes.
Connects to Jira data using arbitrary JQL.
Provides charting tools for creating different data visualizations.
Supports dashboard layout customization and drag-and-drop configuration.
Provides central access to data sources, widgets and dashboards.
Allows individual dashboard elements to be styled with custom color schemes.
630 plugins in Jira · Data and analytics
Price distribution: 189 free, 230 freemium, 211 paid
Create Jira reports, dashboards and visualizations using SIL, HTML, CSS and JavaScript.
Appfire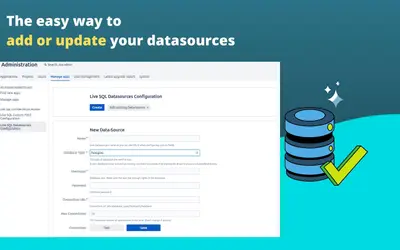
Connects Jira custom fields to external databases through configurable SQL queries and synchronization schedules.
ByteSource Technology Consulting GmbH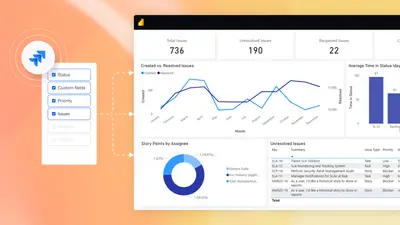
Connects Jira with Power BI for dashboards, reports, custom visuals, and scheduled data refreshes.
Appfire
Connects Jira data to Tableau for dashboards, reports, visualizations, and scheduled refreshes.
Appfire«Smart Boards is an easy, powerful, and flexible data analytic platform for your data. You can create insightful dashboards and surface KPIs and critical information about your data. The wide range of charting tools lets you quickly experiment with different data visualizations. You can customize your dashboard layout …»