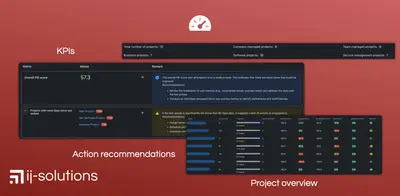
Projects Insight Edge: Overview & KPI Analytics for Jira
Analyze Jira project KPIs, trends, issue metrics, access, and project health through dashboards and scheduled reports.
ij-solutionsFreemium
Visualizes Jira team workload with color-coded heatmaps, capacity views, trend analysis, and workload forecasts.
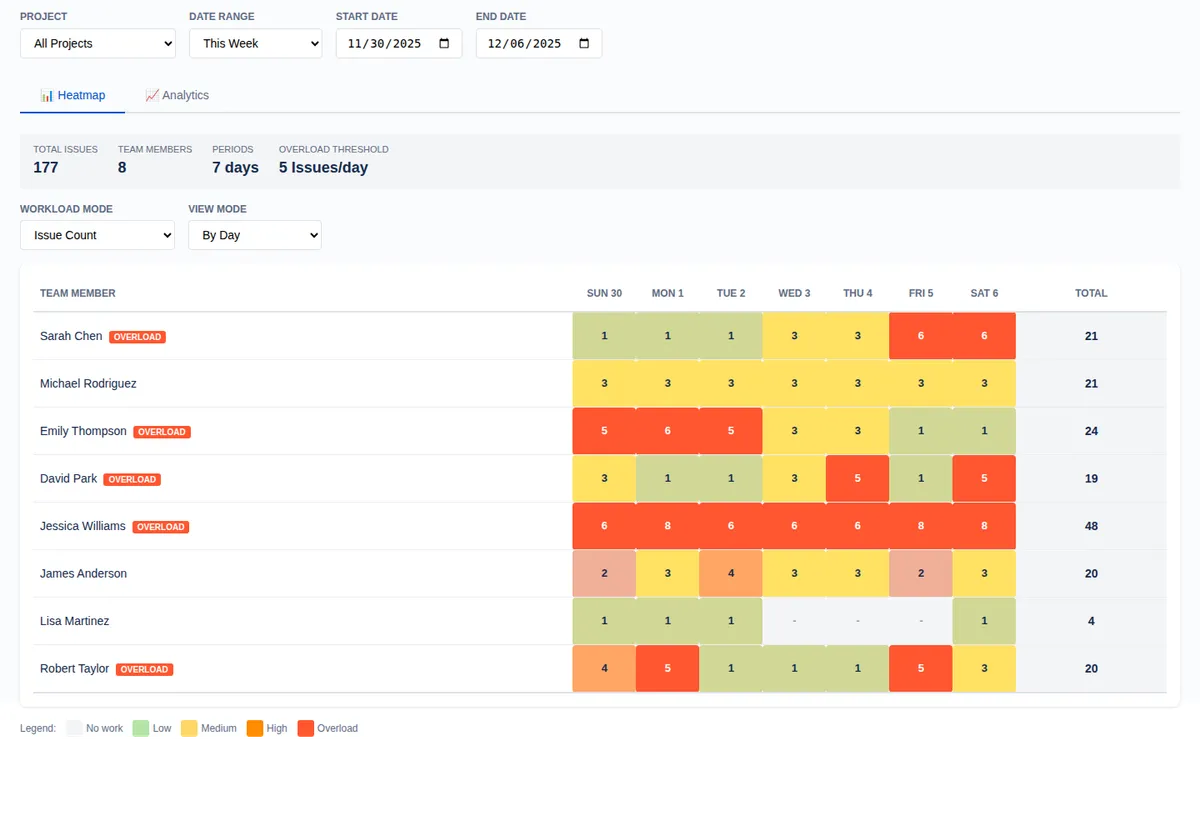
Resource HeatMap displays workload by team member in daily, weekly, or monthly views. Jira administrators and project managers can calculate workload using issue counts, story points, or time estimates. Its dashboard shows utilization, workload, team size, capacity alerts, and workload trends. Capacity views compare actual workload with team capacity for each period, while predictions use historical trends.
A color-coded grid displays workload intensity for each team member.
Workload can be viewed by day, week, or month.
The add-in calculates workload from issue count, story points, or time estimates.
The capacity view compares actual workload with team capacity for each period.
The dashboard shows whether workload is increasing, decreasing, or stable.
Forecasts use historical workload trends.
Jira administrators and project managers.
Resource HeatMap and Projects Insight Edge: Overview & KPI Analytics for Jira are both freemium cloud listings. Capacity Planner - Resource Planning in Jira is also freemium and cloud-based, 13 ratingCount, it was updated in Sep 2026.
| Name | Pricing | Deployment | Updated |
|---|---|---|---|
| this plugin | Freemium | Cloud | |
| Projects Insight Edge: Overview & KPI Analytics for Jira | Freemium | Cloud | |
| Capacity Planner - Resource Planning in Jira | Freemium | Cloud |
630 plugins in Jira · Data and analytics
Price distribution: 189 free, 230 freemium, 211 paid
Analyze Jira project KPIs, trends, issue metrics, access, and project health through dashboards and scheduled reports.
ij-solutions
Plan and track Jira sprints using views of team capacity, workload, utilization, availability, and velocity.
iSynergy TechSys Pvt. Ltd.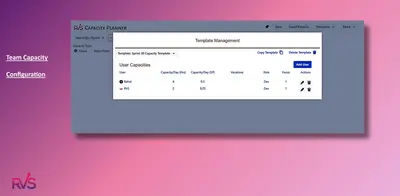
Plans Jira team capacity across sprints using availability, effort estimates, leave, and workload reports.
RVS Softek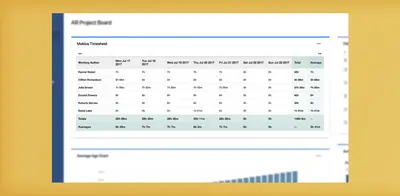
Track and report time logged in Jira by users, projects, tasks, or custom fields.
Heckr«Overview Resource Heatmap is a powerful workload visualization tool that helps Jira administrators and project managers understand how work is distributed across their team. Using an intuitive color-coded heatmap, you can instantly identify who's overloaded, who has capacity, and how workload trends are evolving over …»