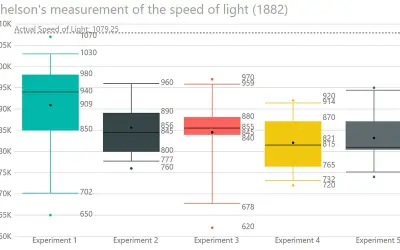
Box and Whisker chart
Displays the five-number summary of numerical datasets in Power BI, showing quartiles, median, mean, and whiskers.
DataScenariosPaid
Displays three or more quantitative variables as a radial polygon chart in GitHub.
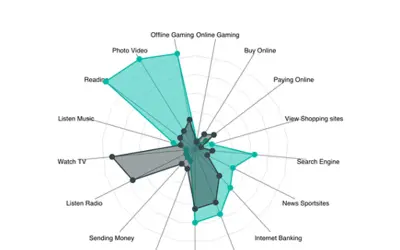
Displays multivariate data on a two-dimensional chart with one axis for each variable. The axes start at the center, use equal spacing, and maintain the same scale. Values are plotted on the axes and connected to form a polygon, with grid lines available as a guide. The visual is open source, with code available on GitHub.
Creates an axis from the center for each variable in the dataset.
Maintains the same scale across all axes.
Connects plotted variable values to form a polygon.
Uses axis-to-axis grid lines as a visual guide.
51 plugins in GitHub · Analytics
Price distribution: 1 free, 2 freemium, 42 paid, 6 price not published
Displays the five-number summary of numerical datasets in Power BI, showing quartiles, median, mean, and whiskers.
DataScenarios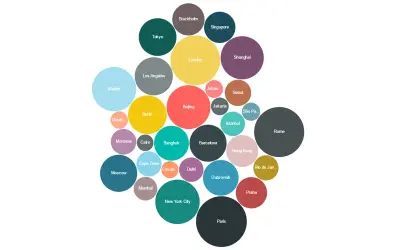
Bubble Chart by Akvelon is a Power BI visual that packs bubbles tightly to display more categories in a given space.
Akvelon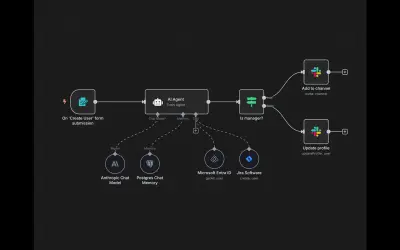
n8n is a workflow automation and AI app platform that connects APIs and internal tools for business processes.
n8n GmbH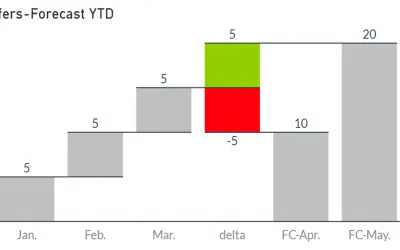
Waterfall-Visual-Extended renders waterfall and bridge charts with delta elements, custom bars, and configurable labels and axes.
Auxil Management GmbH«A radar chart is a graphical method of displaying multivariate data in the form of a two-dimensional chart of three or more quantitative variables represented on axes starting from the same point. The relative position and angle of the axes is typically uninformative. Each variable is provided an axis that starts from …»