
Power Plot Visual by Akvelon
Creates visualizations from diverse chart types, combines multiple charts on one canvas, and adds custom annotations and tooltips.
AkvelonFreemium
Displays historical Intune Data Warehouse information through pre-built Power BI reports.
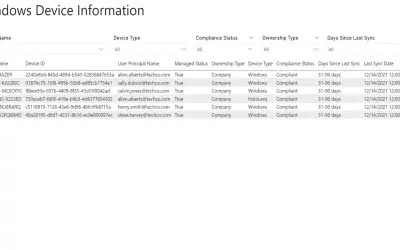
Provides pre-built Power BI reports using the Intune Data Warehouse. The reports present historical Intune information as visual reports.
Includes reports based on information from the Intune Data Warehouse.
Presents historical Intune information in visual reports.
IT administrators using Microsoft Endpoint Manager and the Intune Data Warehouse.
2,531 plugins in Analytics
Price distribution: 125 free, 147 freemium, 1,350 paid, 909 price not published
Creates visualizations from diverse chart types, combines multiple charts on one canvas, and adds custom annotations and tooltips.
Akvelon
Creates financial and business reports in Power BI with automatic variance calculations, P&L logic, and drill-down (s5, s6).
Zebra BI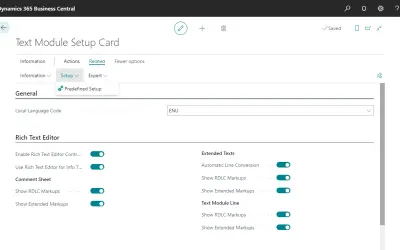
COSMO Text Module provides extended text management with a WYSIWYG editor for Microsoft Dynamics 365 Business Central.
COSMO CONSULT
Discover the why behind your data.
Data Courage«Microsoft Endpoint Manager provides IT admins with a multitude of reporting services regarding device health and security. Most of these services provide simple and easy to understand reports built-in to the portal for the administrator's convenience. However, the Intune Data Warehouse only provides an OData feed for …»