
Power BI Analytics
Records all Power BI Service activity and stores the full history in your own data repository without time or capacity limits.
BismartPaid
View Power BI dashboards and reports in SharePoint, send notifications, add follow-up actions, comment on data points, and update data sources.
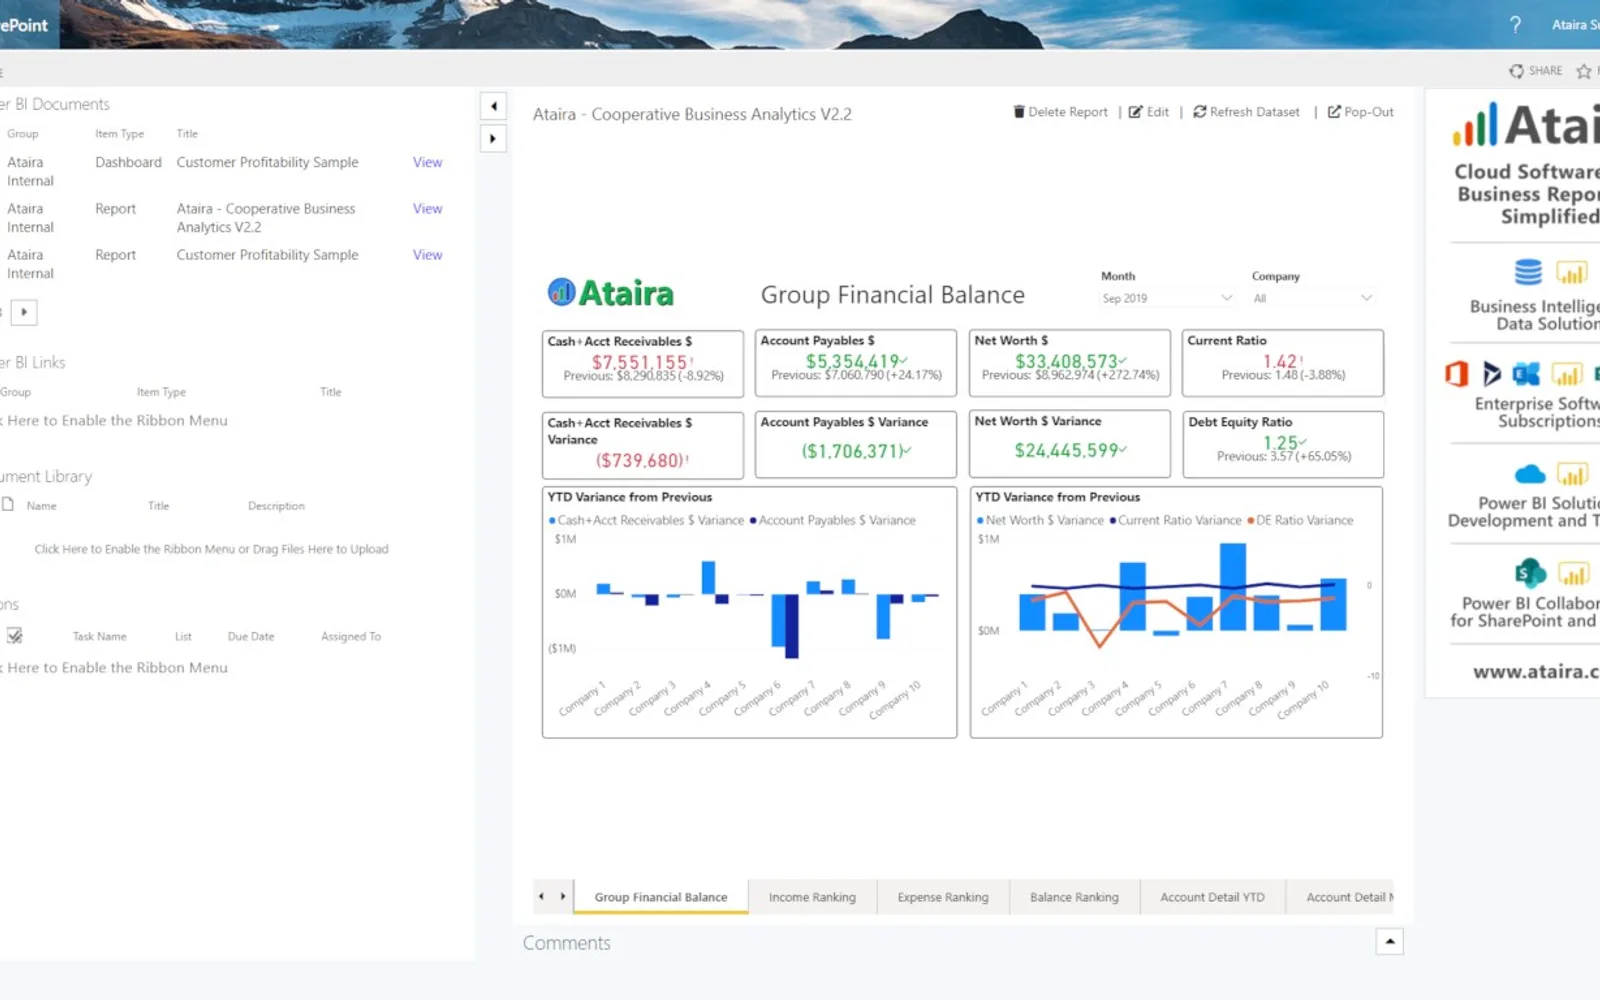
The add-in displays Power BI dashboards and reports in a SharePoint web part. It sends notifications to corporate groups and teams and adds follow-up actions. It supports public Power BI links, comments on report data points, and data files as report data sources with real-time updates.
Displays Power BI dashboards and reports in a SharePoint web part.
Sends notifications to corporate groups and teams.
Adds follow-up actions.
Adds comments to data points in Power BI reports.
Adds data files as data sources to Power BI reports and updates them in real time.
Power BI Collaboration has unknown pricing and cloud deployment. Power BI Analytics and Autodesk® Data Connector for Power BI - Viewer are paid and cloud-deployed, while Data Dictionary by MAQ Software is paid and cloud-deployed. Power BI Collaboration was updated on Jan 2025, compared with Aug 2026 for Power BI Analytics, Jul 2026 for Autodesk® Data Connector for Power BI - Viewer, and Nov 2024 for Data Dictionary by MAQ Software.
| Name | Pricing | Deployment | Updated |
|---|---|---|---|
| this plugin | Price not published | Cloud | |
| Power BI Analytics | Paid | Cloud | |
| Autodesk® Data Connector for Power BI - Viewer | Paid | Cloud | |
| Data Dictionary by MAQ Software | Paid | Cloud |
1,469 plugins in Power BI · Analytics
Price distribution: 89 free, 138 freemium, 678 paid, 564 price not published
Records all Power BI Service activity and stores the full history in your own data repository without time or capacity limits.
Bismart
Fetches data from Data Exchanges and feeds them into Microsoft Power BI to construct comprehensive reports and dashboards.
Autodesk, Inc.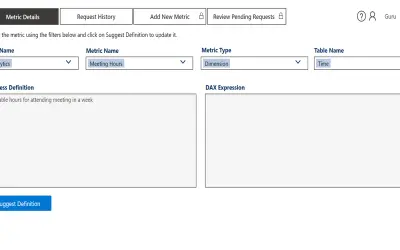
Power App for searching and filtering metric definitions in Power BI reports and databases, with admin-approved updates.
MAQ LLC
Gantt Chart is a project management visual for Microsoft Power BI that tracks schedules, milestones, and resource workloads.
ChartPad«With the Ataira SharePoint Power BI Group Collaboration add-in you can view your Power BI dashboards and reports within a convenient SharePoint web part. Send notifications to your corporate groups and teams, add follow-up actions, embed Power BI public links, add comments to data points in your reports and add data …»