
Power Plot Visual by Akvelon
Creates visualizations from diverse chart types, combines multiple charts on one canvas, and adds custom annotations and tooltips.
AkvelonFreemium
Automates changes to report filter values for playback on wall displays and trend viewing.
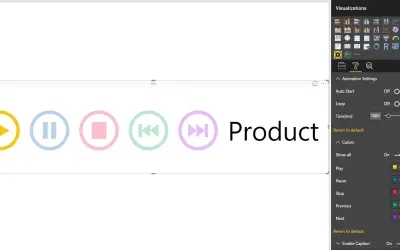
Changes report filter values automatically after playback starts. It can display reports on wall displays without repeated manual clicks. Playback can also be used to observe how data changes over time and look for patterns.
Changes report filter values during playback.
Runs reports on wall displays without repeated manual clicks.
Plays through filter values to show how data evolves.
Supports viewing data changes to look for patterns.
2,531 plugins in Analytics
Price distribution: 125 free, 147 freemium, 1,350 paid, 909 price not published
Creates visualizations from diverse chart types, combines multiple charts on one canvas, and adds custom annotations and tooltips.
Akvelon
Creates financial and business reports in Power BI with automatic variance calculations, P&L logic, and drill-down (s5, s6).
Zebra BI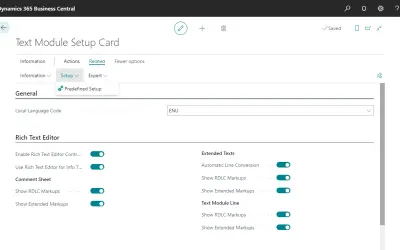
COSMO Text Module provides extended text management with a WYSIWYG editor for Microsoft Dynamics 365 Business Central.
COSMO CONSULT
Discover the why behind your data.
Data Courage«Play Axis it's perfect to show your reports without having to click every time you want to change the values of a filter, being ideal to use on wall displays. It is also great for when you want to see trends or look for patterns in your data since you can click on "play" and just focus on how data is evolving.»