
Power Plot Visual by Akvelon
Creates visualizations from diverse chart types, combines multiple charts on one canvas, and adds custom annotations and tooltips.
AkvelonFreemium
Displays a main measure with up to three additional indicators in one KPI card.
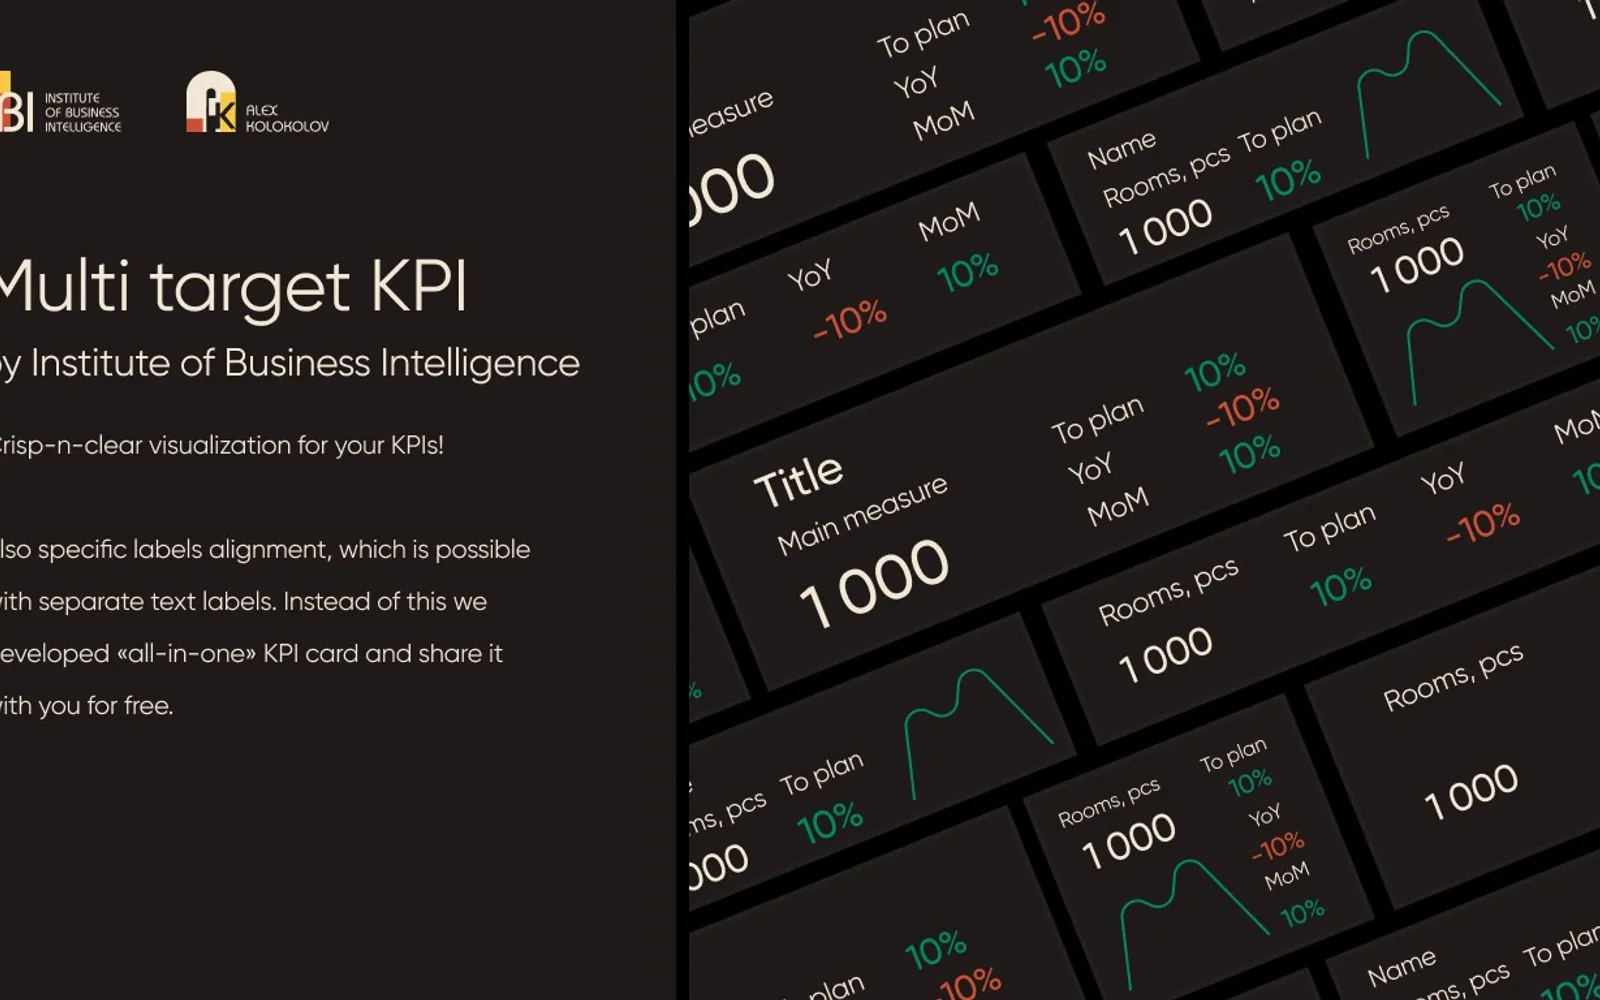
This visual displays a main indicator with up to three additional measures, such as target or previous-year comparisons. It supports category fields, bullet charts, emoji icons, tooltips, and layout settings. Additional measures can use conditional color formatting, while blank and NaN values can be turned off. The card uses a single query.
Displays up to three additional indicators in the same card.
Supports category multipliers.
Includes a bullet chart option.
Provides emoji icons for the card.
Provides pixel-level alignment settings for labels and layout.
Includes settings to turn off blank and NaN values.
Supports conditional color formatting for additional measures.
Business customers and non-designers.
2,531 plugins in Analytics
Price distribution: 125 free, 147 freemium, 1,350 paid, 909 price not published
Creates visualizations from diverse chart types, combines multiple charts on one canvas, and adds custom annotations and tooltips.
Akvelon
Creates financial and business reports in Power BI with automatic variance calculations, P&L logic, and drill-down (s5, s6).
Zebra BI
COSMO Text Module provides extended text management with a WYSIWYG editor for Microsoft Dynamics 365 Business Central.
COSMO CONSULT
Discover the why behind your data.
Data Courage«We are developing dashboards for 15 years, and business customers often ask for several indicators for cards: v/s target, previous year and something else. Also specific labels alignment, which is possible with separate text labels. Instead of this we developed «all-in-one» KPI card and share it with you …»