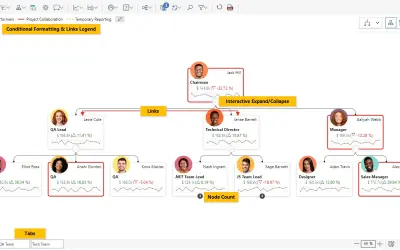
Performance Flow - xViz
Power BI visual for tracking supply chain, sales, and financial performance with interactive diagrams, alerts, and KPIs.
xViz LLC dba LumelFreemium
Explore Power BI hierarchies while tracking up to five KPIs in each node.
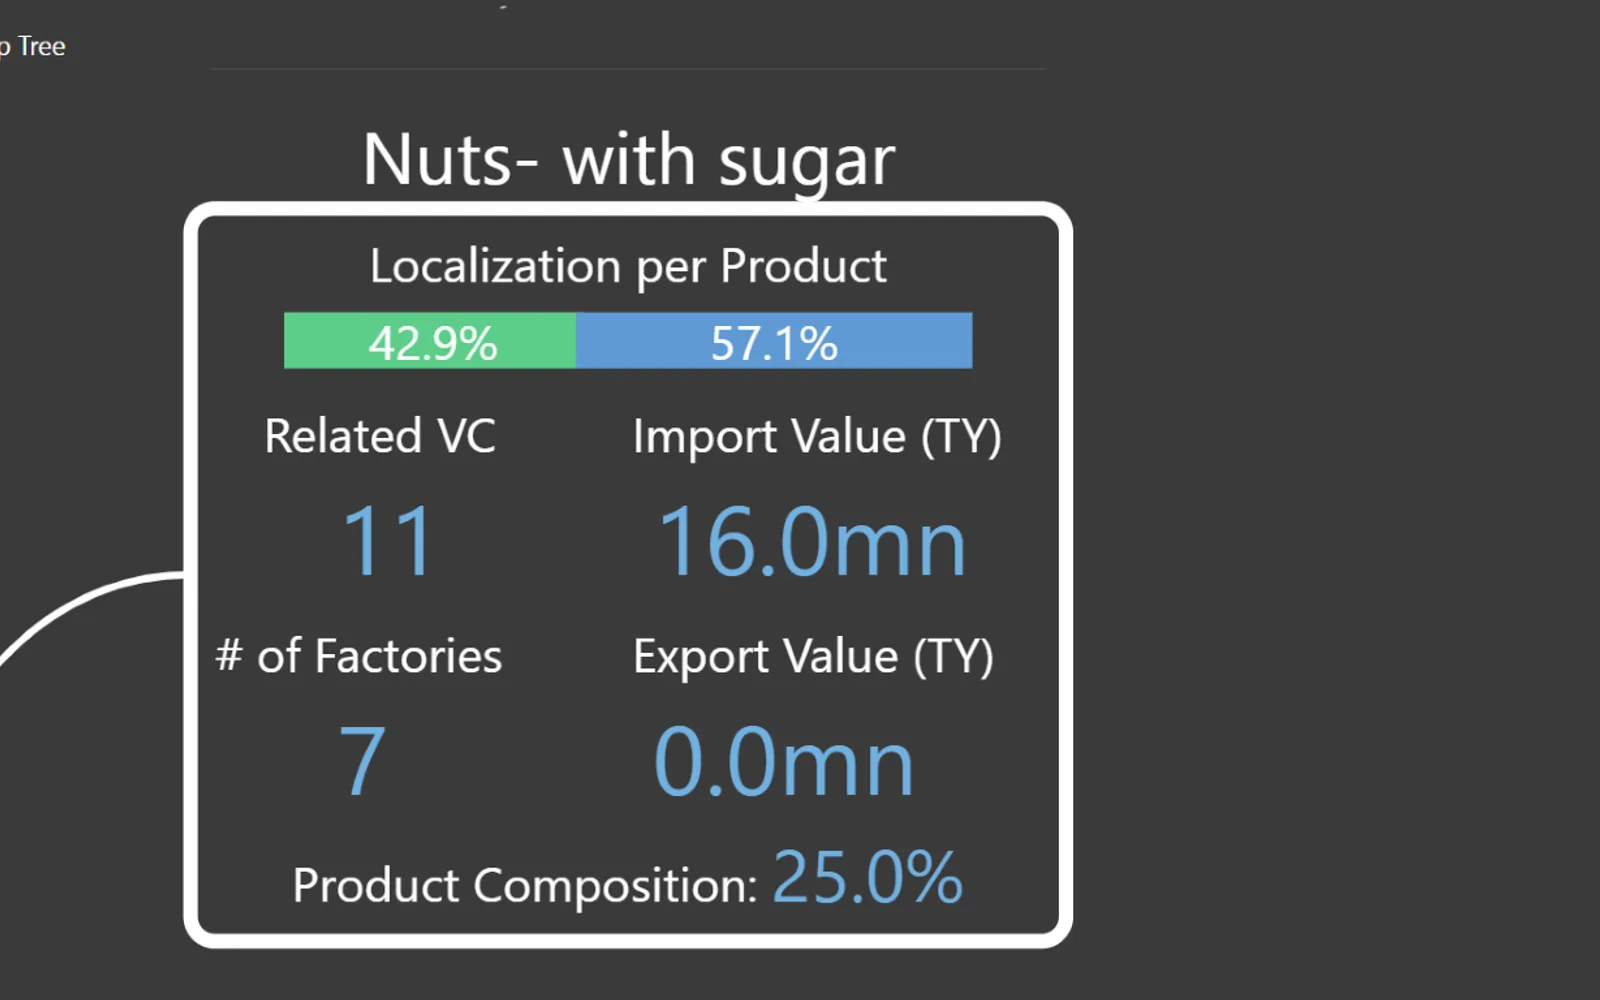
This Power BI visual displays tabular data with hierarchy levels in separate columns alongside KPI columns. It shows up to five KPIs in each node and can include stacked bar charts for proportional breakdowns. Node selection filters related visuals across the report page, while zoom and pan controls support navigation through large hierarchies.
Displays proportional breakdowns inside hierarchy nodes with embedded stacked bar charts.
Displays up to five simultaneous KPIs within each node.
Provides controls for formatting nodes, labels, connectors, and KPI displays.
Filters related visuals across the Power BI report page when a node is selected.
Provides zoom and pan controls for navigating large hierarchies.
Analysts and decision-makers using Power BI.
Multi KPI Decomposition Tree is listed as paid and cloud-deployed, while Performance Flow - xViz is listed as freemium and cloud-deployed. Plumsail Org Chart 365 has an unknown pricing model and is cloud-deployed. Smart Filter Pro by OKVIZ is listed as paid and cloud-deployed, with an update date of Dec 2025.
| Name | Pricing | Deployment | Updated |
|---|---|---|---|
| this plugin | Paid | Cloud | |
| Performance Flow - xViz | Freemium | Cloud | |
| Plumsail Org Chart 365 | Price not published | Cloud | |
| Smart Filter Pro by OKVIZ | Paid | Cloud |
657 plugins in Power BI · Analytics
Price distribution: 73 free, 108 freemium, 441 paid, 35 price not published
Power BI visual for tracking supply chain, sales, and financial performance with interactive diagrams, alerts, and KPIs.
xViz LLC dba Lumel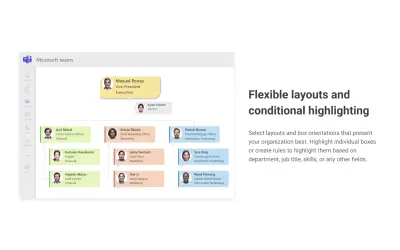
Builds org charts in SharePoint and Microsoft Teams so employees can find colleagues and explore reporting lines.
Plumsail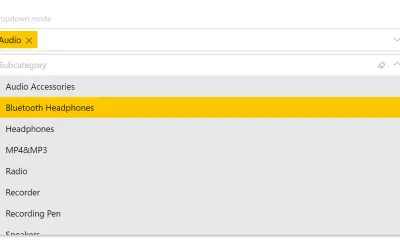
Smart Filter Pro by OKVIZ provides multiple filter modes (drop-down, multi-select, search, hierarchy) for Power BI reports.
OKVIZ Corp.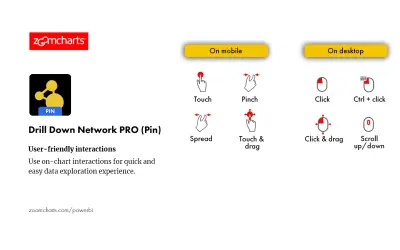
Drill Down Network PRO (Pin) by ZoomCharts renders interactive category-based network charts with drill-down support in Power BI.
ZoomCharts«Multi KPI Decomposition Tree Convergent Business Technologies · Free · All features included Complex hierarchical data rarely tells its full story through a single metric. The Multi KPI Decomposition Tree enables analysts and decision-makers to explore organisational hierarchies while tracking up to five KPIs …»