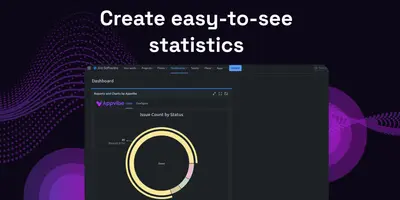
Appvibe Reports Charts Graphs for Jira Dashboard
Create charts and statistics from Jira data for dashboard reporting.
AppvibeFree
Create shareable AI-powered charts from live Jira metrics inside Jira.
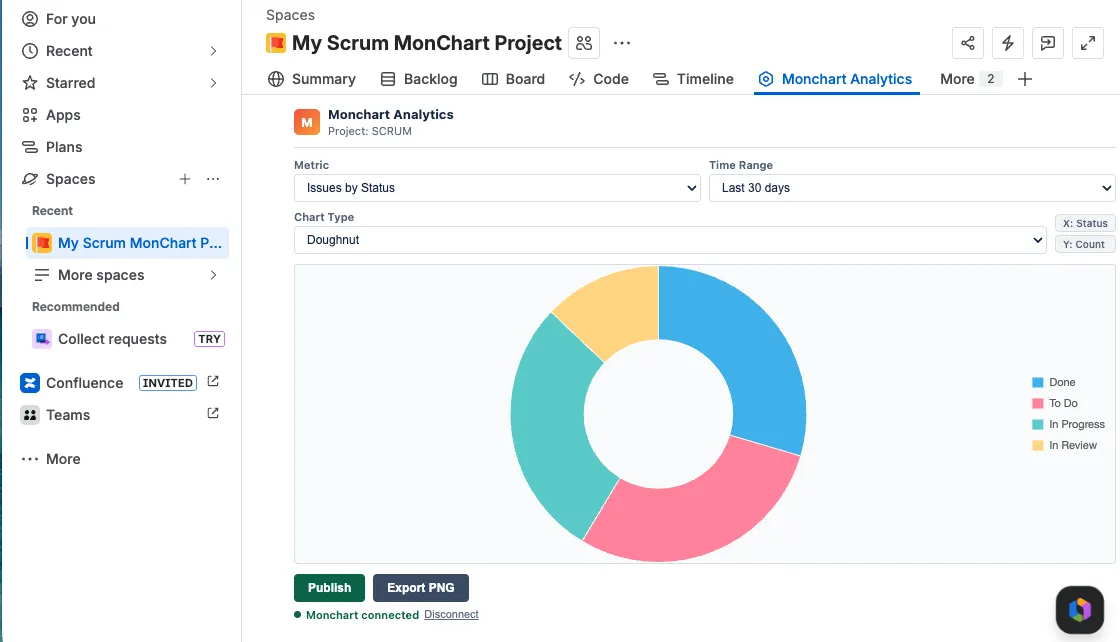
Monchart Analytics turns Jira metrics into charts inside Jira. It supports metrics such as issue status, volume, priority, type, assignee performance, resolution time, sprint, fix version, and overdue issues. Charts can use bar, line, doughnut, or pie formats across 7-day, 30-day, or 90-day ranges. AI summaries generated through Google Gemini describe key trends in plain English, and charts can be published to monchart.com for private sharing, direct-link access, or iframe embedding.
Creates charts for issue status, volume, priority, type, assignee performance, resolution time, labels, components, reporters, sprints, fix versions, and overdue issues.
Supports bar, line, doughnut, and pie charts.
Provides 7-day, 30-day, and 90-day time ranges.
Uses Google Gemini to generate plain-English summaries of key trends.
Publishes charts to monchart.com for iframe embedding, public indexing by Google, private access, or direct-link sharing.
Uses manual sync from the Forge panel and stores aggregate counts rather than raw issue data on monchart.com.
Monchart Analytics is free and cloud-based, as is Appvibe Reports Charts Graphs for Jira Dashboard, while Sum Story Points, Team & Two Dimensional Filter Gadgets is freemium and Spotlight - AI Charts & Reports for Jira is paid. Monchart Analytics was updated in Apr 2026, compared with Feb 2024 for Appvibe Reports Charts Graphs for Jira Dashboard and Aug 2026 for Sum Story Points, Team & Two Dimensional Filter Gadgets.
| Name | Pricing | Deployment | Updated |
|---|---|---|---|
| this plugin | Free | Cloud | |
| Appvibe Reports Charts Graphs for Jira Dashboard | Free | Cloud | |
| Sum Story Points, Team & Two Dimensional Filter Gadgets | Freemium | Cloud | |
| Spotlight - AI Charts & Reports for Jira | Paid | Cloud |
630 plugins in Jira · Data and analytics
Price distribution: 189 free, 230 freemium, 211 paid
Create charts and statistics from Jira data for dashboard reporting.
Appvibe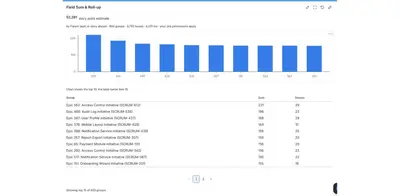
Add Jira dashboard gadgets for numeric totals, field pivots, and epic progress.
Probius Apps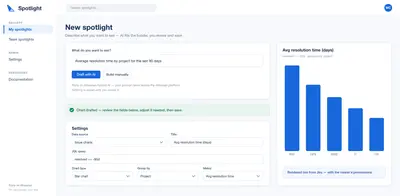
Creates live Jira charts, tables, and reports from plain-language descriptions, JQL, Scrum boards, or form-based configuration.
Bytera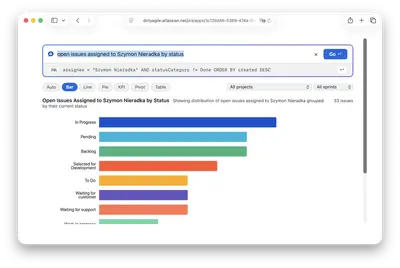
Query Jira in natural language to produce charts, KPIs, or tables without writing JQL.
Dirty Agile«Issues by Status, Issue Volume, Issues by Priority, Issues by Type, Assignee Performance, Resolution Time, Issues by Label, Issues by Component, Issues by Reporter, Issues by Sprint, Issues by Fix Version, Overdue Issues Chart types: Bar, Line, Doughnut, Pie Time ranges: Last 7 days, 30 days, 90 days AI summaries are …»