GPT for Excel Word
Automates formulas, data cleanup, reporting, and bulk row-by-row tasks in Microsoft Excel from plain-language prompts.
TALARIAN S. à r.l.Price not published
Create interactive trend charts from Excel data, pin data points, and add descriptions to the canvas.
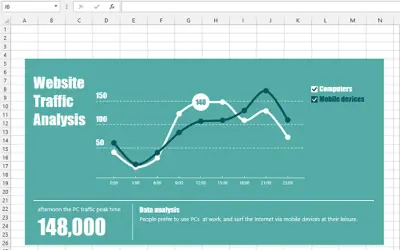
Binds Excel data to an interactive trend chart. Chart lines can be shown or hidden through the legend, and data points can be pinned or unpinned. Descriptions can be added to the canvas, with customizable layouts and multiple themes.
Binds and shows Excel data on a trend chart.
Shows or hides lines through the chart legend.
Pins or unpins data points on the chart.
Adds descriptions directly to the canvas.
Customizes the layout of descriptions.
Provides multiple themes.
446 plugins in Excel · Analytics
Price distribution: 8 free, 17 freemium, 142 paid, 279 price not published
Automates formulas, data cleanup, reporting, and bulk row-by-row tasks in Microsoft Excel from plain-language prompts.
TALARIAN S. à r.l.
Artemis Sheets pulls blockchain, protocol, and stablecoin metrics into Excel workbooks using CapIQ-like formula syntax.
Artemis Analytics
Excel add-in providing real-time quotes and up to 30+ years of historical price and fundamental data for 80,000+ global assets.
SheetsFinance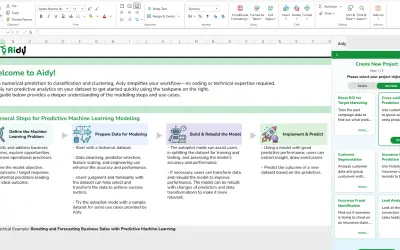
An Excel 365 add-in that automates no-code machine learning for numerical prediction, classification, and clustering.
Aide Aye Applications Inc.«Now you have a new way to tell a story based on your Excel data. With a few selections, your data is shown on an interactive trend chart. You can pin the specific data points on the chart, and add descriptions on the canvas. Currently, the app can do the following: • Bind and show your data on a trend chart • Basic …»