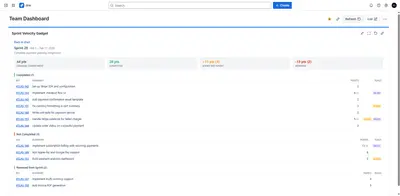
Sprint Velocity Gadget for Jira
Displays Jira sprint velocity with committed and completed points, issue-level breakdowns, and trend lines on dashboards.
Plugin VaultFreemium
Creates Jira charts from date fields to compare planned and actual progress, including burndown and burn-up views.
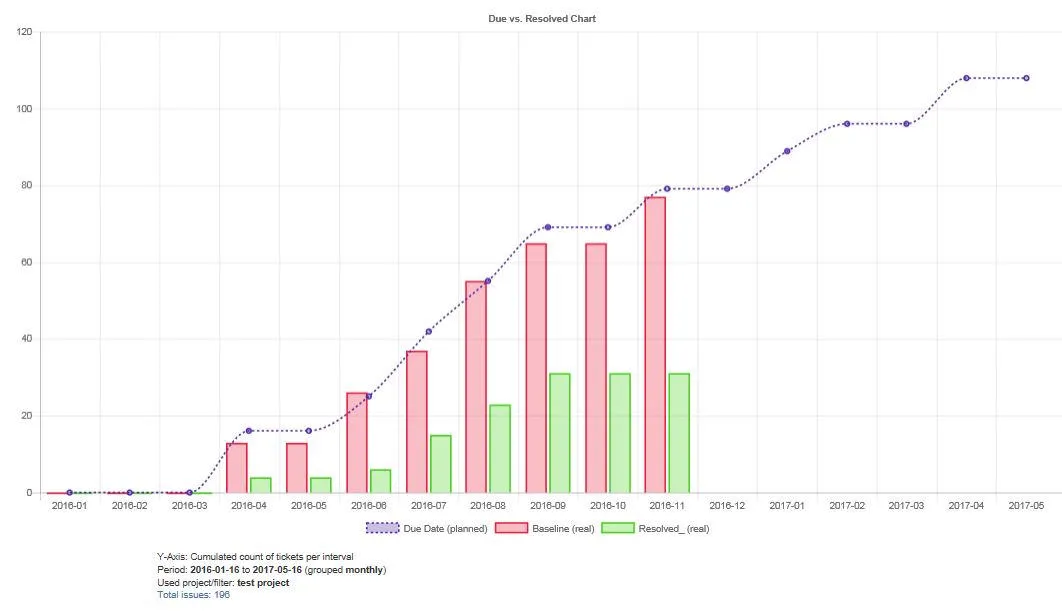
Creates diagrams from Jira ticket date fields, such as due dates and resolution dates, to compare planned and actual progress. Charts can show ticket counts or sums of numeric fields, including story points and time estimates. Data can be displayed by day, week, or month as totals or accumulated values, with configurable date ranges, curve types, colors, and refresh settings. Charts can use a project or configurable filter, include trend and ideal burndown lines, and open related issue lists when chart elements are selected.
Displays progress as burndown or burn-up charts.
Builds charts from selected Jira date fields.
Shows ticket counts or sums of numeric field data such as story points and time estimates.
Groups chart data into daily, weekly, or monthly periods as total or accumulated values.
Uses a Jira project or configurable filter as the chart data source.
Adds burndown trendlines, ideal burndown lines, and growth lines for backlog additions.
Opens the related issue list when a chart element is clicked.
Provides configurable curve types, date ranges, color layouts, auto-refresh, and x-axis range settings.
Mirrorlake Plan Chart 2D is freemium and supports cloud, server, and data-center deployment, while Sprint Velocity Gadget for Jira is freemium and cloud-only. Simple Custom Reports, Charts & Dashboard Gadgets for Jira and Advanced Burndown Chart Dashboard Gadget for Jira are also freemium with cloud, server, and data-center deployment; both were updated in Sep 2026, compared with Mirrorlake Plan Chart 2D's Apr 2026 update.
| Name | Pricing | Deployment | Updated |
|---|---|---|---|
| this plugin | Freemium | Cloud · Data Center · Server | |
| Sprint Velocity Gadget for Jira | Freemium | Cloud | |
| Simple Custom Reports, Charts & Dashboard Gadgets for Jira | Freemium | Cloud · Data Center · Server | |
| Advanced Burndown Chart Dashboard Gadget for Jira | Freemium | Cloud · Data Center · Server |
630 plugins in Jira · Data and analytics
Price distribution: 189 free, 230 freemium, 211 paid
Displays Jira sprint velocity with committed and completed points, issue-level breakdowns, and trend lines on dashboards.
Plugin Vault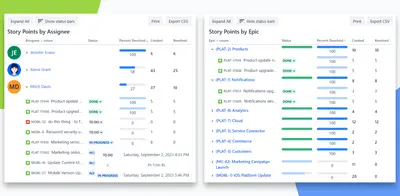
Create custom Jira reports, charts, and dashboard gadgets for sprint, issue, time, and status tracking.
Agilis LT (Simple Reports)
Jira gadgets for Gantt schedules, worklogs, SLAs, number-field charts, and issue status counts.
Eisonesoft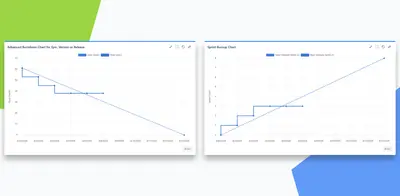
Create Jira dashboard burndown and burnup charts for sprints, epics, releases, versions, or JQL-filtered data.
Agilis LT (Simple Reports)«Plan chart 2d can create diagrams based on date fields in your tickets. Features in detail are: Display as burn-down or burn-up chart Shows amount of tickets or sum of field data, e.g. storypoints or time estimates Show multiple charts based on available date fields Show data in time periods as total or accumulated …»