
Power Plot Visual by Akvelon
Creates visualizations from diverse chart types, combines multiple charts on one canvas, and adds custom annotations and tooltips.
AkvelonFreemium
Aggregates and normalizes building data through an API and analytics application.
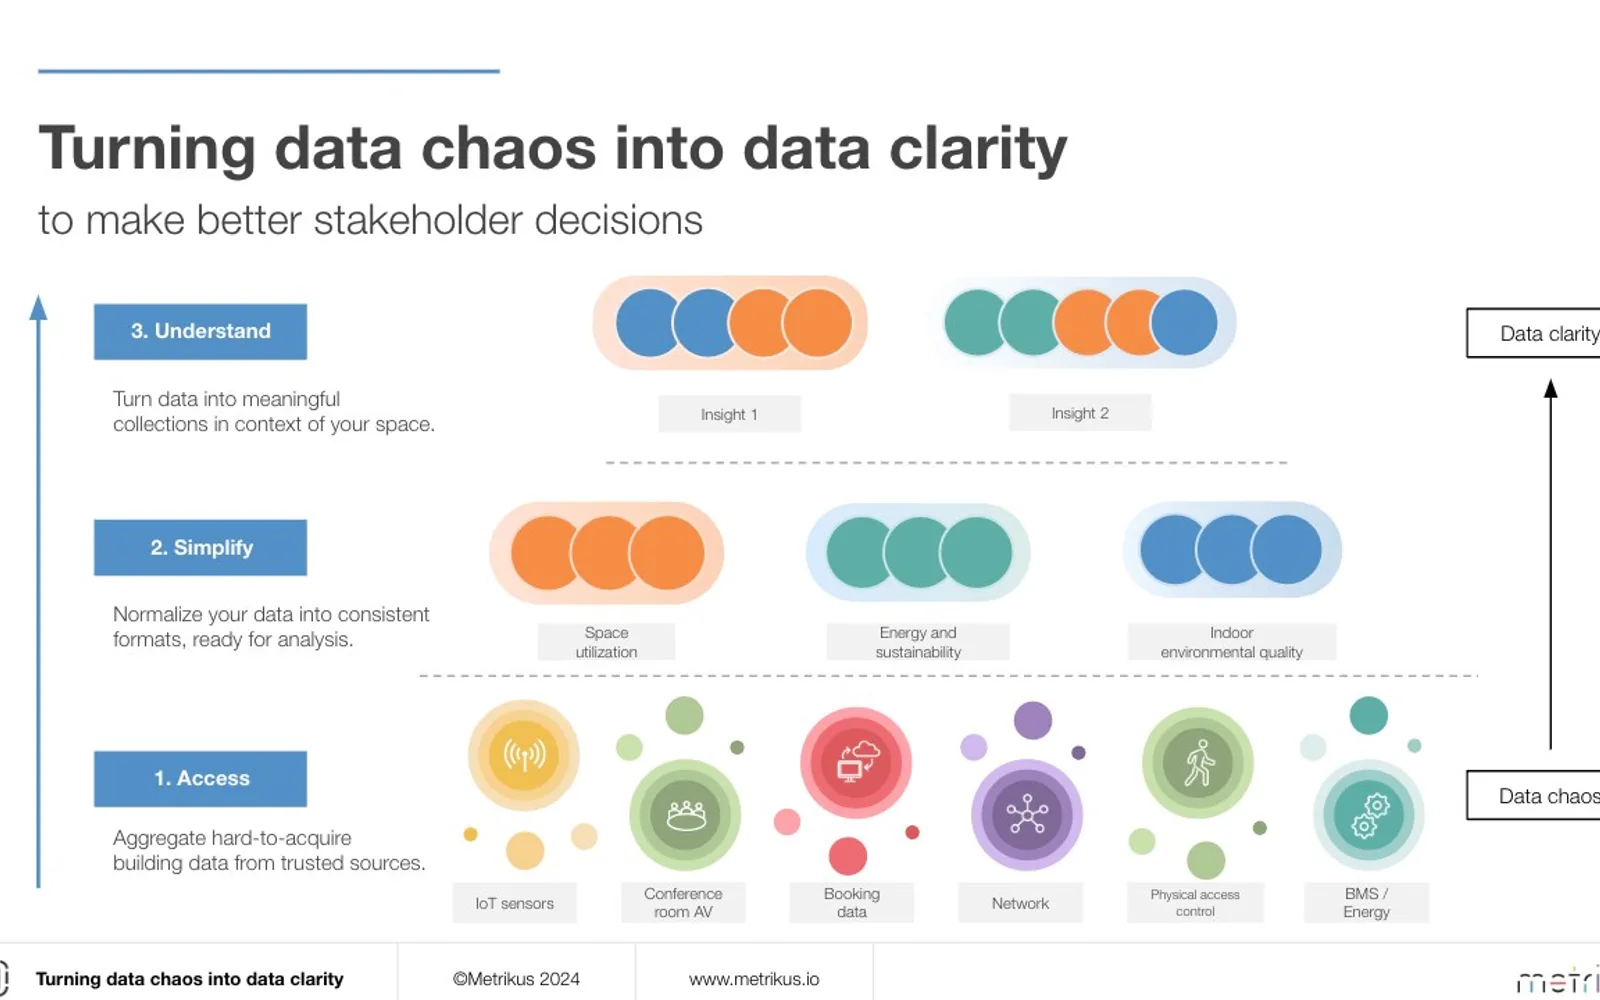
Metrikus aggregates building data from multiple sources and normalizes it into consistent formats. Its API provides occupancy, people count, indoor air quality, environmental, energy and water data. Its analytics application provides filtering, drill-down views and performance tracking against specific targets.
Aggregates building data from a range of sources.
Normalizes building data into consistent formats.
Provides access to aggregated building data through an API.
Provides occupancy, people count, indoor air quality, environmental, energy and water data.
Provides filtering functionality for viewing selected building data.
Tracks performance against specific targets.
Metrikus names people who run buildings and their stakeholders as its users.
2,531 plugins in Analytics
Price distribution: 125 free, 147 freemium, 1,350 paid, 909 price not published
Creates visualizations from diverse chart types, combines multiple charts on one canvas, and adds custom annotations and tooltips.
Akvelon
Creates financial and business reports in Power BI with automatic variance calculations, P&L logic, and drill-down (s5, s6).
Zebra BI
COSMO Text Module provides extended text management with a WYSIWYG editor for Microsoft Dynamics 365 Business Central.
COSMO CONSULT
Discover the why behind your data.
Data Courage«Operating buildings is complicated, and their data is in a state of chaos. Without data that’s easy to access and understand, it’s incredibly difficult for the people who run buildings to make decisions that make their spaces as efficient, productive and sustainable as they can be. It’s a colossal waste of time, money …»