
Power Plot Visual by Akvelon
Creates visualizations from diverse chart types, combines multiple charts on one canvas, and adds custom annotations and tooltips.
AkvelonFreemium
Calendar for viewing and editing tasks and events in monthly, weekly, and daily views.
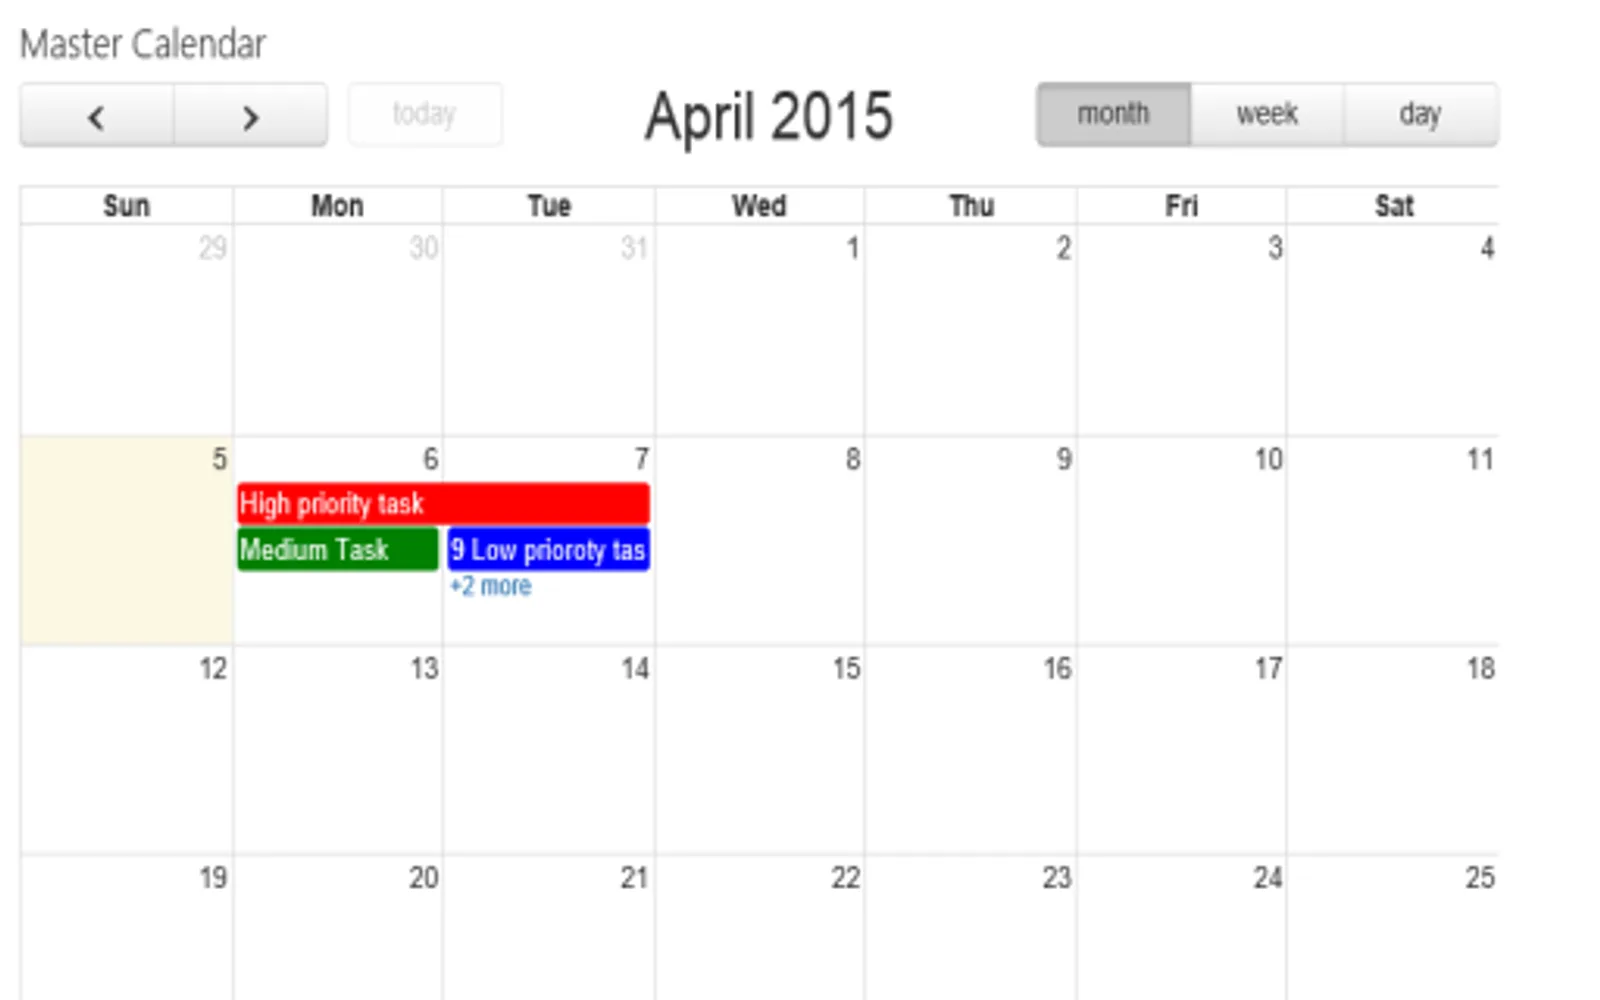
Displays tasks and events together in monthly, weekly, and daily views. It supports modifying priority-based sources and colors, context-based editing, local-time timetables, live-information tooltips, and 50 language choices.
Displays tasks and events in monthly, weekly, and daily views.
Supports modifying priority-based sources.
Supports modifying colors.
Supports editing by author, assignee, or administrator context.
Provides different views for tasks with long or short durations.
Displays timetables according to the user's local time.
Provides live information through tooltips.
Offers a choice of 50 languages.
2,531 plugins in Analytics
Price distribution: 125 free, 147 freemium, 1,350 paid, 909 price not published
Creates visualizations from diverse chart types, combines multiple charts on one canvas, and adds custom annotations and tooltips.
Akvelon
Creates financial and business reports in Power BI with automatic variance calculations, P&L logic, and drill-down (s5, s6).
Zebra BI
COSMO Text Module provides extended text management with a WYSIWYG editor for Microsoft Dynamics 365 Business Central.
COSMO CONSULT
Discover the why behind your data.
Data Courage«With this fantastic calendar you can quickly view and edit all tasks and events, and access live information in a fast and easy manner: -Modifying Priority based sources and colors -See All tasks and events at a glance, the whole group. -Edition in Context-based Author, Assigned or Administrator. -Different Views for …»