
Power Plot Visual by Akvelon
Creates visualizations from diverse chart types, combines multiple charts on one canvas, and adds custom annotations and tooltips.
AkvelonFreemium
Create interactive maps from spreadsheet data in an office document.
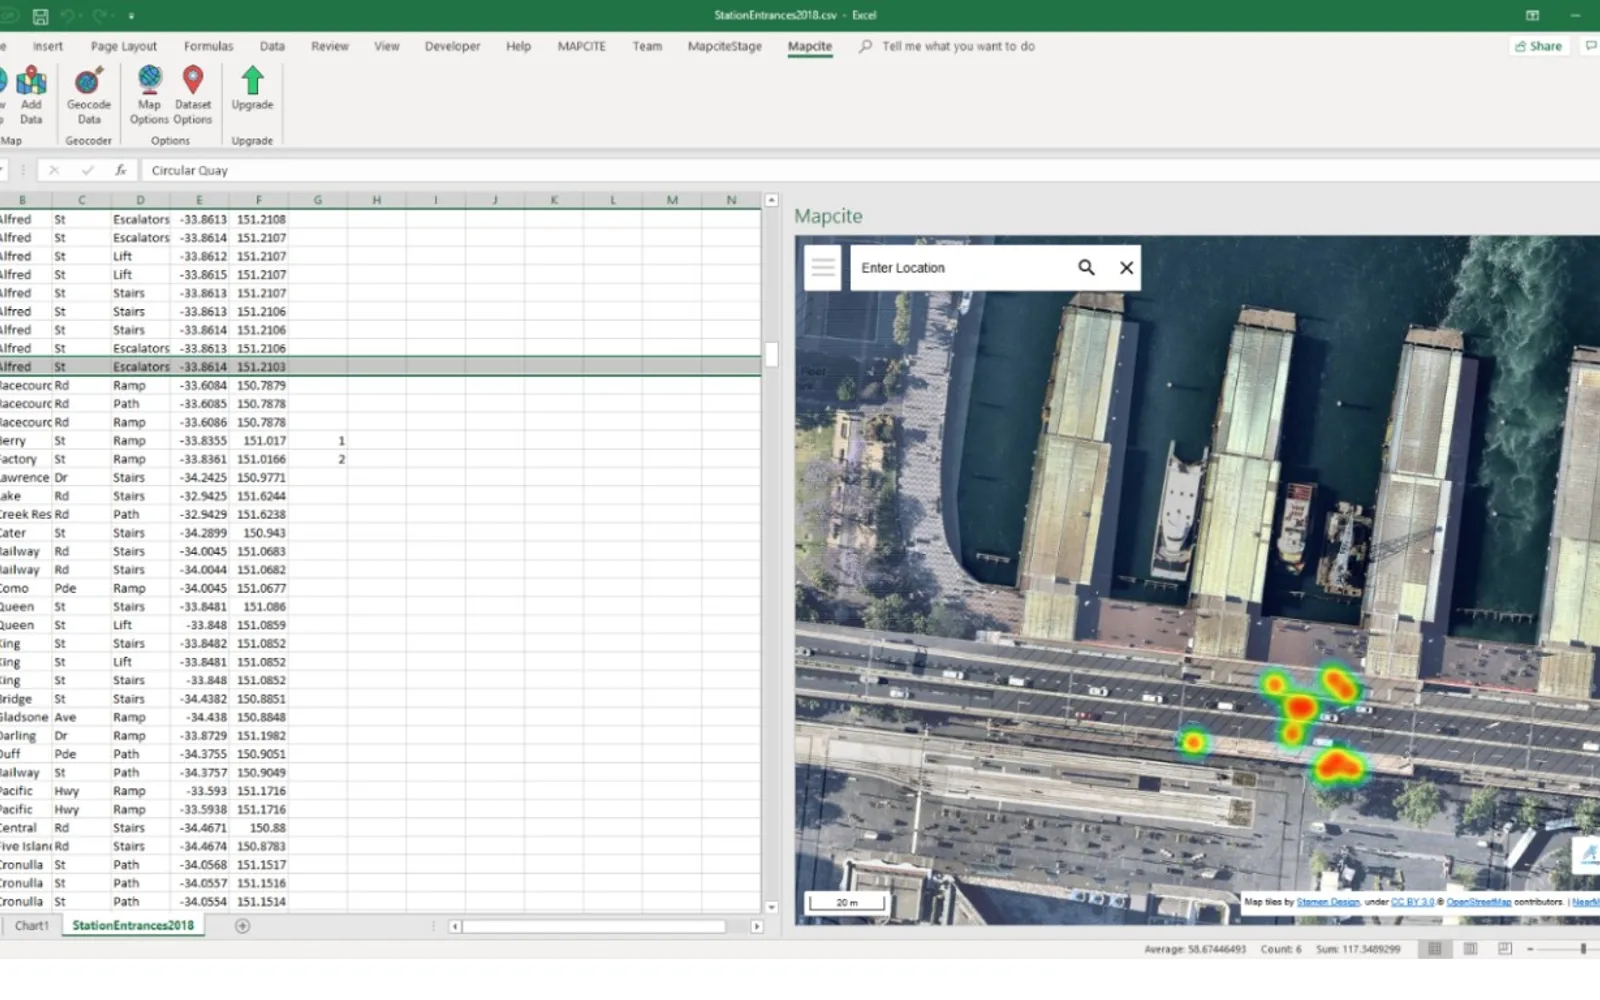
Map spreadsheet data as clickable points or heatmaps in an interactive web mapping add-in. Geocode data when latitude and longitude fields are unavailable. Users can choose base maps and use filtering, location and POI search, drawing, export, printing, sharing, and publishing features. Spatial functions can find nearest or furthest locations and count or sum values within a radius.
Geocode data when latitude and longitude fields are unavailable.
Create interactive maps that respond to spreadsheet data.
Display mapped data as clickable points or heatmaps.
Search for locations and points of interest.
Find nearest or furthest locations and count or sum values within a radius.
Export, print, share, and publish maps.
Estimate CO2 for business travel or logistics purposes.
2,531 plugins in Analytics
Price distribution: 125 free, 147 freemium, 1,350 paid, 909 price not published
Creates visualizations from diverse chart types, combines multiple charts on one canvas, and adds custom annotations and tooltips.
Akvelon
Creates financial and business reports in Power BI with automatic variance calculations, P&L logic, and drill-down (s5, s6).
Zebra BI
COSMO Text Module provides extended text management with a WYSIWYG editor for Microsoft Dynamics 365 Business Central.
COSMO CONSULT
Discover the why behind your data.
Data Courage«An easy way to create maps from the comfort of your office document. Quickly create striking map visuals with your data and gain new location insights. Recently added Distance Matrix and Spatial Analytics functions Where you do not already have latitude/longitude coordinate fields, geocode your data in a few clicks …»