
Power Plot Visual by Akvelon
Creates visualizations from diverse chart types, combines multiple charts on one canvas, and adds custom annotations and tooltips.
AkvelonFreemium
Kubernetes resource monitoring and dynamic pod and container management.
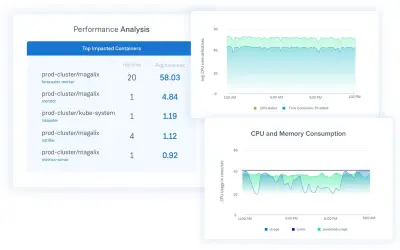
Magalix provides information about CPU, memory, and network use across Kubernetes clusters. It forecasts utilization for the next few hours and identifies unusual usage patterns. Magalix Autopilot dynamically manages pod and container resources and shows how cluster-size changes affect performance.
Reports CPU, memory, and network distribution across a Kubernetes cluster.
Shows projected resource utilization for the next few hours.
Identifies unusual usage patterns in the cluster.
Magalix Autopilot manages resources for pods and containers.
Shows how changes in cluster size affect performance.
2,531 plugins in Analytics
Price distribution: 125 free, 147 freemium, 1,350 paid, 909 price not published
Creates visualizations from diverse chart types, combines multiple charts on one canvas, and adds custom annotations and tooltips.
Akvelon
Creates financial and business reports in Power BI with automatic variance calculations, P&L logic, and drill-down (s5, s6).
Zebra BI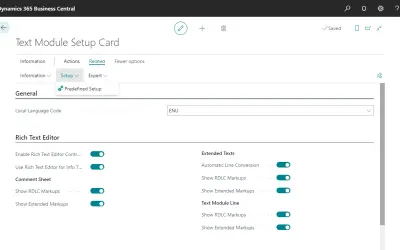
COSMO Text Module provides extended text management with a WYSIWYG editor for Microsoft Dynamics 365 Business Central.
COSMO CONSULT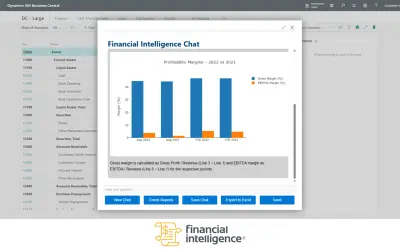
Discover the why behind your data.
Data Courage«Magalix provides unique insights and recommendations about resource utilization inside Kubernetes. Magalix Autopilot right sizes Kubernetes clusters by dynamically managing resources of pods and containers. Save up to 50% of your cloud bill. Stay on top of capacity management. Get Insights: - What is the distribution …»