
Power Plot Visual by Akvelon
Creates visualizations from diverse chart types, combines multiple charts on one canvas, and adds custom annotations and tooltips.
AkvelonFreemium
Displays calculation values in a card visual with optional comparisons and a problem indicator.
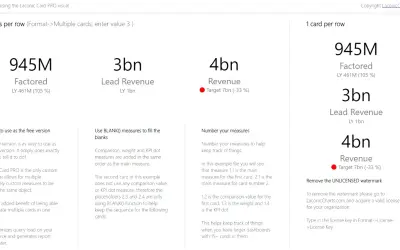
Displays values as they appear in calculations. A main measure is required, while comparison measures and a problem flag are optional. It renders cards as one visual and includes a red-dot problem indicator.
Displays a required main measure using the value shown in the calculation.
Supports two additional measures for anchoring and comparing values.
Provides an optional problem flag shown as a red dot.
Renders all cards as one visual within a report.
2,531 plugins in Analytics
Price distribution: 125 free, 147 freemium, 1,350 paid, 909 price not published
Creates visualizations from diverse chart types, combines multiple charts on one canvas, and adds custom annotations and tooltips.
Akvelon
Creates financial and business reports in Power BI with automatic variance calculations, P&L logic, and drill-down (s5, s6).
Zebra BI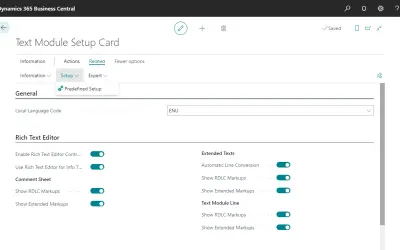
COSMO Text Module provides extended text management with a WYSIWYG editor for Microsoft Dynamics 365 Business Central.
COSMO CONSULT
Discover the why behind your data.
Data Courage«Laconic Card PRO focuses on delivering information in the clearest possible way. All values are displayed as they are in your calculations, giving you full control over the information displayed. The only mandatory component is the main measure, remaining comparison measures and problem flag are optional.»