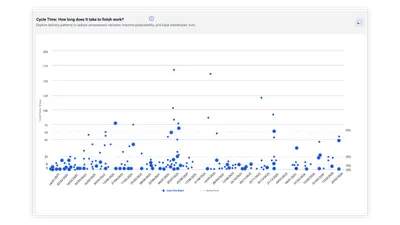
ActionableAgile® Analytics: Kanban/ Agile Metrics, Forecasts
Analyze Jira flow data through charts, cycle-time analysis, forecasts, and simulations.
55 Degrees ABPaid
Track Jira work with cycle time scatter plots and aging work in progress charts.
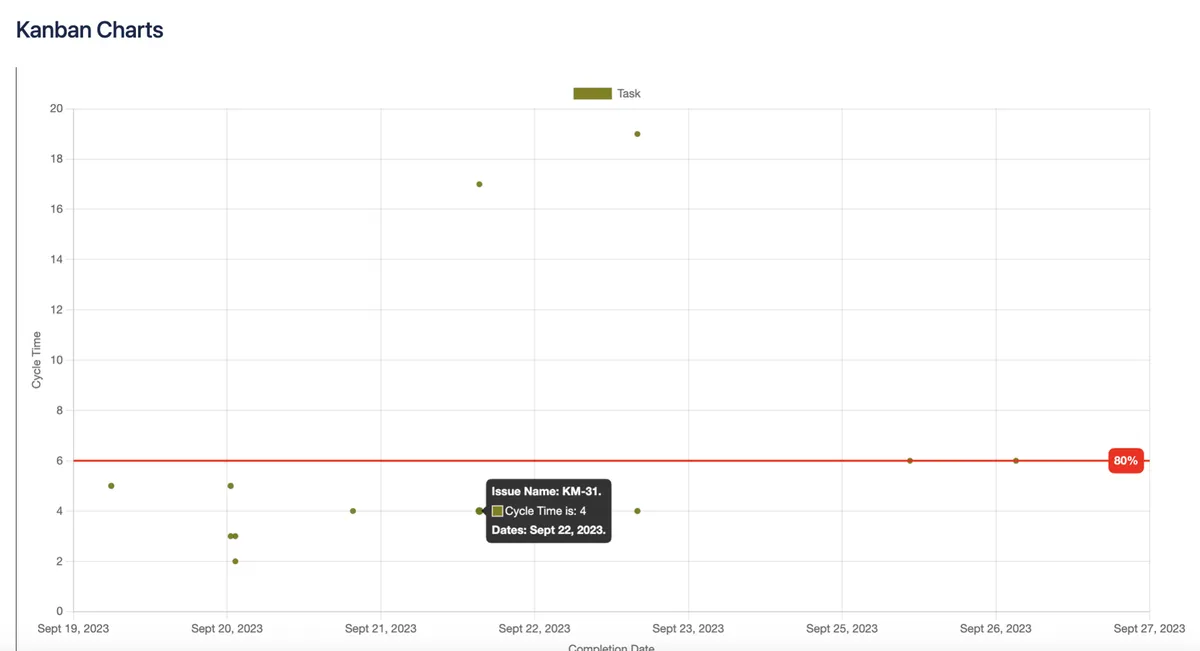
Kanban Charts provides a cycle time scatter plot and an aging work in progress chart in Jira. Configuration includes issue types, a cycle time field, a date range, and a percentile line value. The aging chart lists in-progress work by age and status.
Displays cycle time data in a scatter plot chart.
Shows in-progress work sorted by age and status.
Allows selection of issue types, a cycle time field, a date range, and a percentile line value.
Kanban management practitioners.
Kanban Charts is a paid, cloud-only Jira add-in. ActionableAgile® Analytics: Kanban/ Agile Metrics, Forecasts and Agile Charts - WIP, Cycle & Lead Time, Time Trends are paid and support cloud, server, and data-center deployments, while Time in Status Reports for Jira is freemium and supports cloud and data-center deployments. Flow Metrics & Forecasting — Cycle Time & Kanban for Jira and Kanban Flow Metrics: Lead Time & Cycle Time for Jira are freemium and cloud-only.
| Name | Pricing | Deployment | Updated |
|---|---|---|---|
| this plugin | Paid | Cloud | |
| ActionableAgile® Analytics: Kanban/ Agile Metrics, Forecasts | Paid | Cloud · Data Center · Server | |
| Agile Charts - WIP, Cycle & Lead Time, Time Trends | Paid | Cloud · Data Center · Server | |
| Time in Status Reports for Jira | Freemium | Cloud · Data Center | |
| Flow Metrics & Forecasting — Cycle Time & Kanban for Jira | Freemium | Cloud | |
| Kanban Flow Metrics: Lead Time & Cycle Time for Jira | Freemium | Cloud |
1,328 plugins in Jira · Project Management
Price distribution: 444 free, 418 freemium, 466 paid
Analyze Jira flow data through charts, cycle-time analysis, forecasts, and simulations.
55 Degrees AB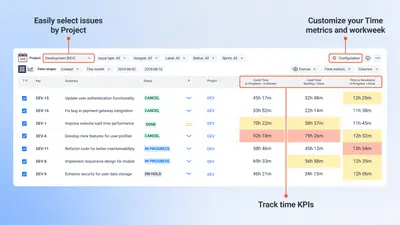
Analyze Jira workflow timing, WIP, status delays, and trends with charts, metrics, limits, and exports.
SaaSJet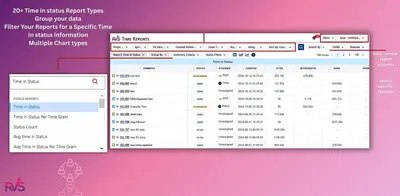
Track Jira issue time by status and assignee with reports, charts, trends, and exports.
RVS Softek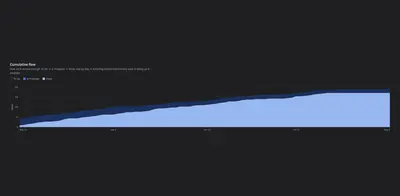
Forecasts Jira delivery dates and throughput using flow metrics, cycle time, Kanban charts, and Monte Carlo analysis.
9ByNight«The Kanban Charts app brings you essential Kanban charts like the cycle time scatter plot chart and aging work in progress. These charts are probably the most important charts to help you as a Kanban management practitioner. You can configure which issue types to include, a date range, your cycle time field and the …»