
Power Plot Visual by Akvelon
Creates visualizations from diverse chart types, combines multiple charts on one canvas, and adds custom annotations and tooltips.
AkvelonFreemium
Turns resources into interactive, accessible learning experiences with tools for English language learners.
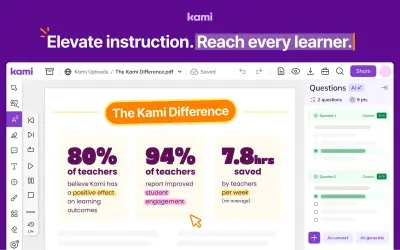
Kami turns resources into interactive learning experiences. It includes tools for English language learners. The platform supports teaching, grading, and lesson planning workflows.
Turns resources into interactive learning experiences.
Provides accessible learning experiences.
Includes built-in tools for English language learners.
Teachers and school leaders.
2,531 plugins in Analytics
Price distribution: 125 free, 147 freemium, 1,350 paid, 909 price not published
Creates visualizations from diverse chart types, combines multiple charts on one canvas, and adds custom annotations and tooltips.
Akvelon
Creates financial and business reports in Power BI with automatic variance calculations, P&L logic, and drill-down (s5, s6).
Zebra BI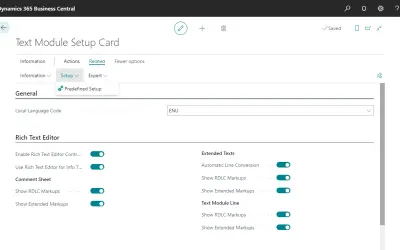
COSMO Text Module provides extended text management with a WYSIWYG editor for Microsoft Dynamics 365 Business Central.
COSMO CONSULT
Discover the why behind your data.
Data Courage«Elevate instruction. Reach every learner. Kami’s game-changing learning platform turns any resource into interactive, accessible experiences that spark curiosity and success. Trusted by over 50+ million users, it brings learning to life—engaging every student, including English language learners with built-in tools to …»