
Power Plot Visual by Akvelon
Creates visualizations from diverse chart types, combines multiple charts on one canvas, and adds custom annotations and tooltips.
AkvelonFreemium
Interprets business questions in OpsVeda and returns filtered data, visualizations, and drill-downs.
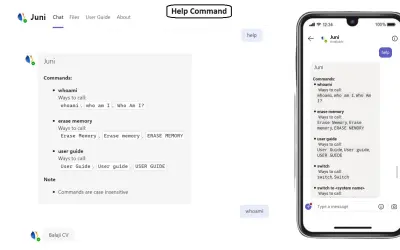
Juni interprets business questions using natural language processing and domain understanding. It retrieves data from the OpsVeda platform with required filters, then assembles visualizations and provides drill-downs.
Interprets users' business questions using natural language processing and domain understanding.
Pulls data from the OpsVeda platform using required filters.
Assembles visualizations from data retrieved from the OpsVeda platform.
Provides drill-downs for the results.
Users of the OpsVeda platform.
2,531 plugins in Analytics
Price distribution: 125 free, 147 freemium, 1,350 paid, 909 price not published
Creates visualizations from diverse chart types, combines multiple charts on one canvas, and adds custom annotations and tooltips.
Akvelon
Creates financial and business reports in Power BI with automatic variance calculations, P&L logic, and drill-down (s5, s6).
Zebra BI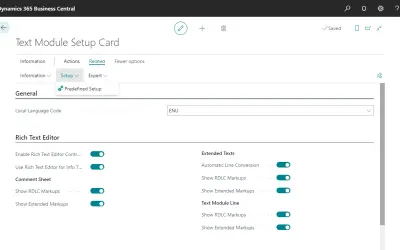
COSMO Text Module provides extended text management with a WYSIWYG editor for Microsoft Dynamics 365 Business Central.
COSMO CONSULT
Discover the why behind your data.
Data Courage«Juni, an OpsVeda’s AI agent, Juni provides contextual answers to users. It utilizes Natural Language Processing (NLP) and domain understanding to interpret users’ business questions, pull the right data from OpsVeda platform with the required filters, assemble the visualizations and provide the drill-downs. It goes …»