
Power Plot Visual by Akvelon
Creates visualizations from diverse chart types, combines multiple charts on one canvas, and adds custom annotations and tooltips.
AkvelonFreemium
Interest-based segmentation of consumer audiences in a visual dashboard.
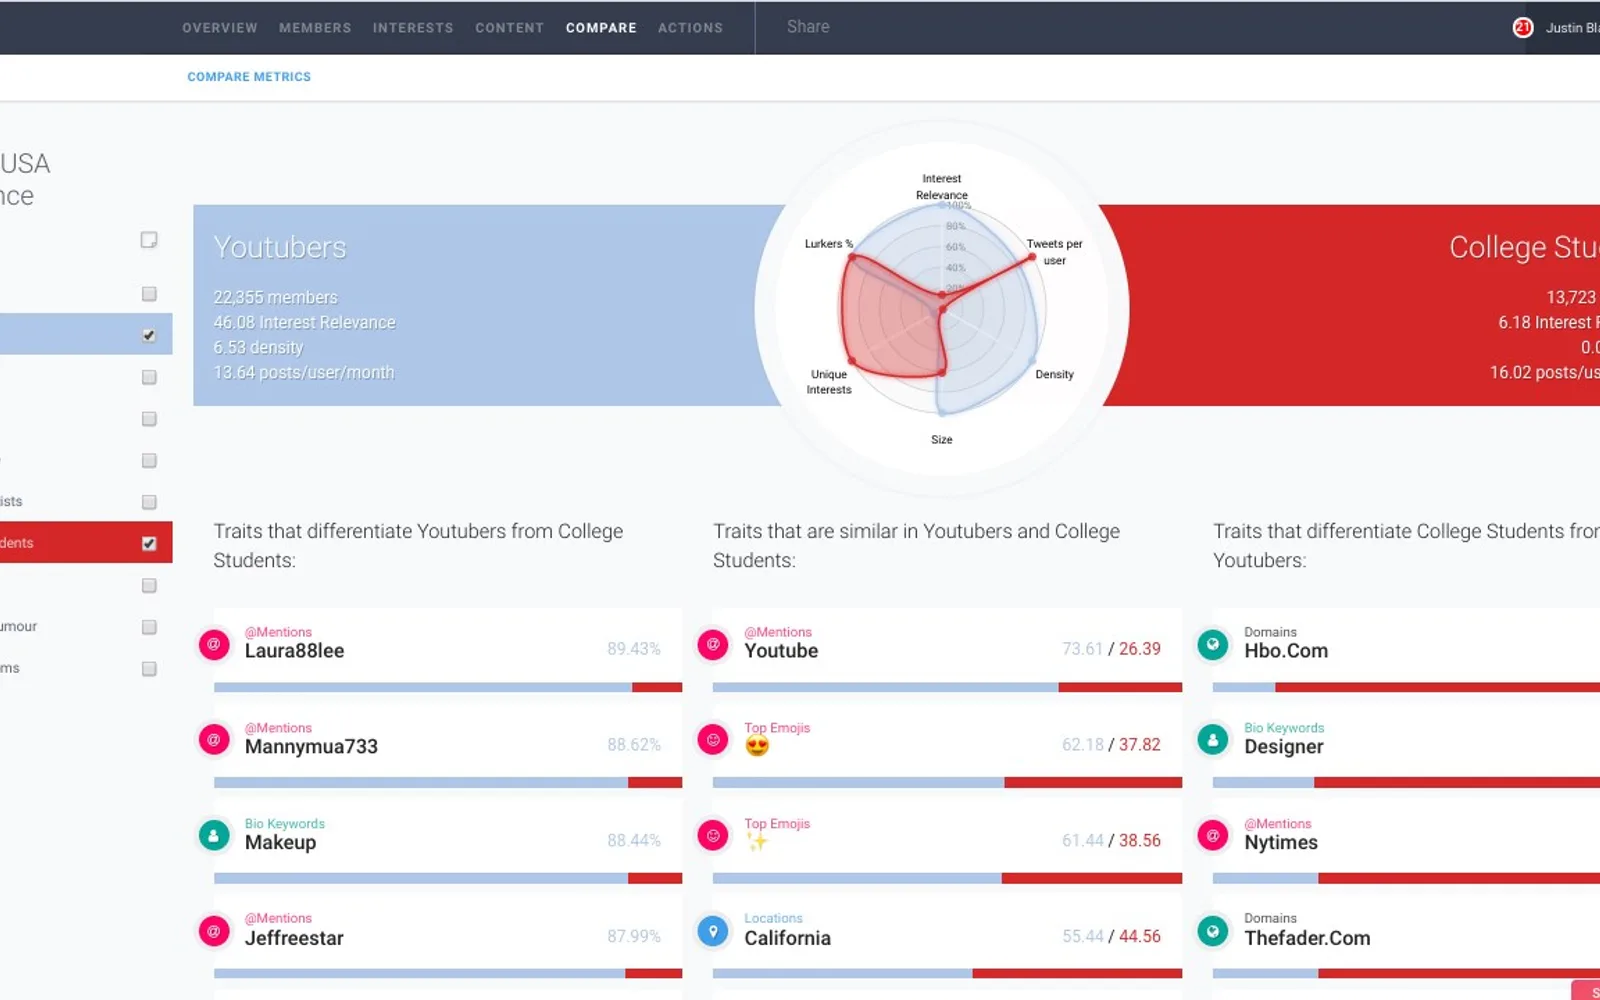
Analyzes consumer data and groups users into interest-based segments according to shared commonalities. The results appear in a dashboard showing audience interests and affinities. The listing also describes views of brand and product resonance within targeted audiences, along with brands, influencers, and media channels associated with those audiences.
Groups users into interest-based segments according to shared commonalities.
Displays audience interests and affinities in a visual dashboard.
Shows how brands and products resonate within targeted audiences.
Identifies audience segments without current products or marketing initiatives.
Identifies brands to partner with, influencers, and media channels for targeted audiences.
2,531 plugins in Analytics
Price distribution: 125 free, 147 freemium, 1,350 paid, 909 price not published
Creates visualizations from diverse chart types, combines multiple charts on one canvas, and adds custom annotations and tooltips.
Akvelon
Creates financial and business reports in Power BI with automatic variance calculations, P&L logic, and drill-down (s5, s6).
Zebra BI
COSMO Text Module provides extended text management with a WYSIWYG editor for Microsoft Dynamics 365 Business Central.
COSMO CONSULT
Discover the why behind your data.
Data Courage«Affinio’s Integrated Audience Analysis solution reveals hidden audience insights at scale. Designed for the enterprise, the solution turns incomprehensible amounts of consumer data into actionable insights. Our unsupervised clustering technology segments users into interest-based segments based on the …»