
Power Plot Visual by Akvelon
Creates visualizations from diverse chart types, combines multiple charts on one canvas, and adds custom annotations and tooltips.
AkvelonFreemium
Compares entities with an X/Y bubble chart, optional bars, and a play axis for changes over time.
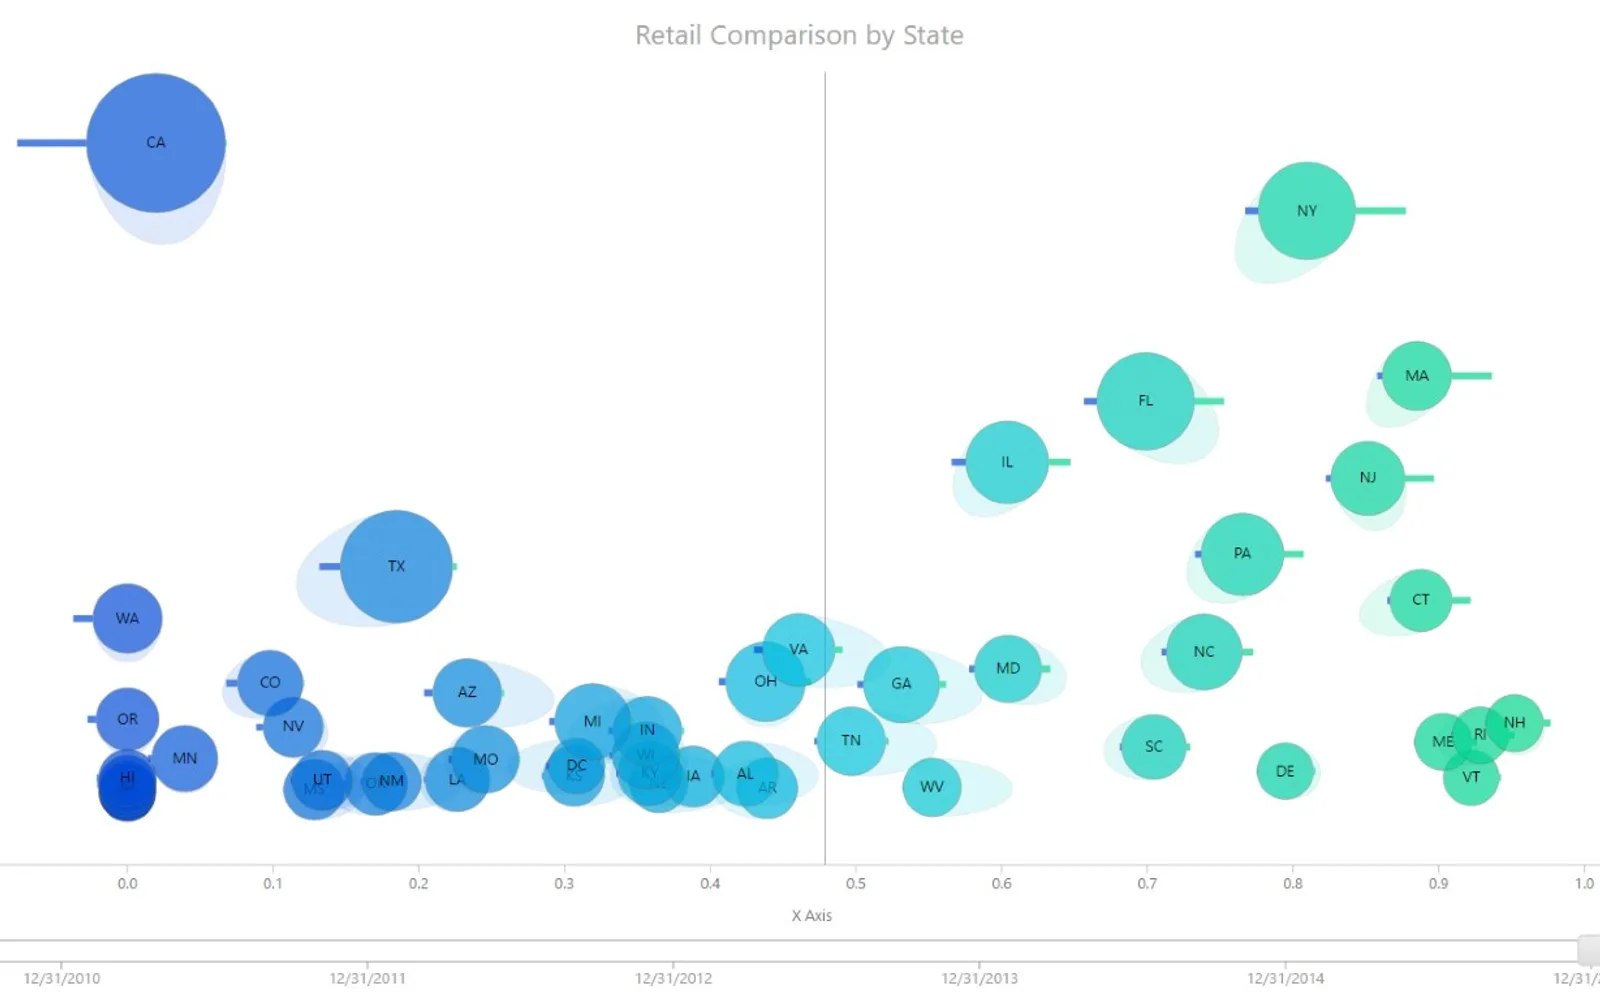
Displays named bubbles using numerical X- and Y-axis values. Optional bubble size, left bar, and right bar fields add data to the chart. A play axis groups bubbles by another value and provides controls to move between items or loop through them. Bubble tails indicate changes from the previous data point when a play axis is used.
Plots named bubbles using numerical X-axis and Y-axis values.
Supports optional Bubble Size, Left Bar, and Right Bar fields.
Groups bubbles by a Play Axis and provides next, previous, slider, and loop controls.
Shows tails on bubbles to indicate changes from the previous data point.
2,531 plugins in Analytics
Price distribution: 125 free, 147 freemium, 1,350 paid, 909 price not published
Creates visualizations from diverse chart types, combines multiple charts on one canvas, and adds custom annotations and tooltips.
Akvelon
Creates financial and business reports in Power BI with automatic variance calculations, P&L logic, and drill-down (s5, s6).
Zebra BI
COSMO Text Module provides extended text management with a WYSIWYG editor for Microsoft Dynamics 365 Business Central.
COSMO CONSULT
Discover the why behind your data.
Data Courage«Using the position of the bubbles in X/Y space, along with the optional left and right bars this chart can be used to compare relative data from either entity. Unique to this chart, the “tails” on each bubble give an indication of change in data from the previous data point (see Play Axis below). The chart supports …»