
Power Plot Visual by Akvelon
Creates visualizations from diverse chart types, combines multiple charts on one canvas, and adds custom annotations and tooltips.
AkvelonFreemium
Monitors broadcasts, streams, venues, and uploaded audio for content-use tracking.
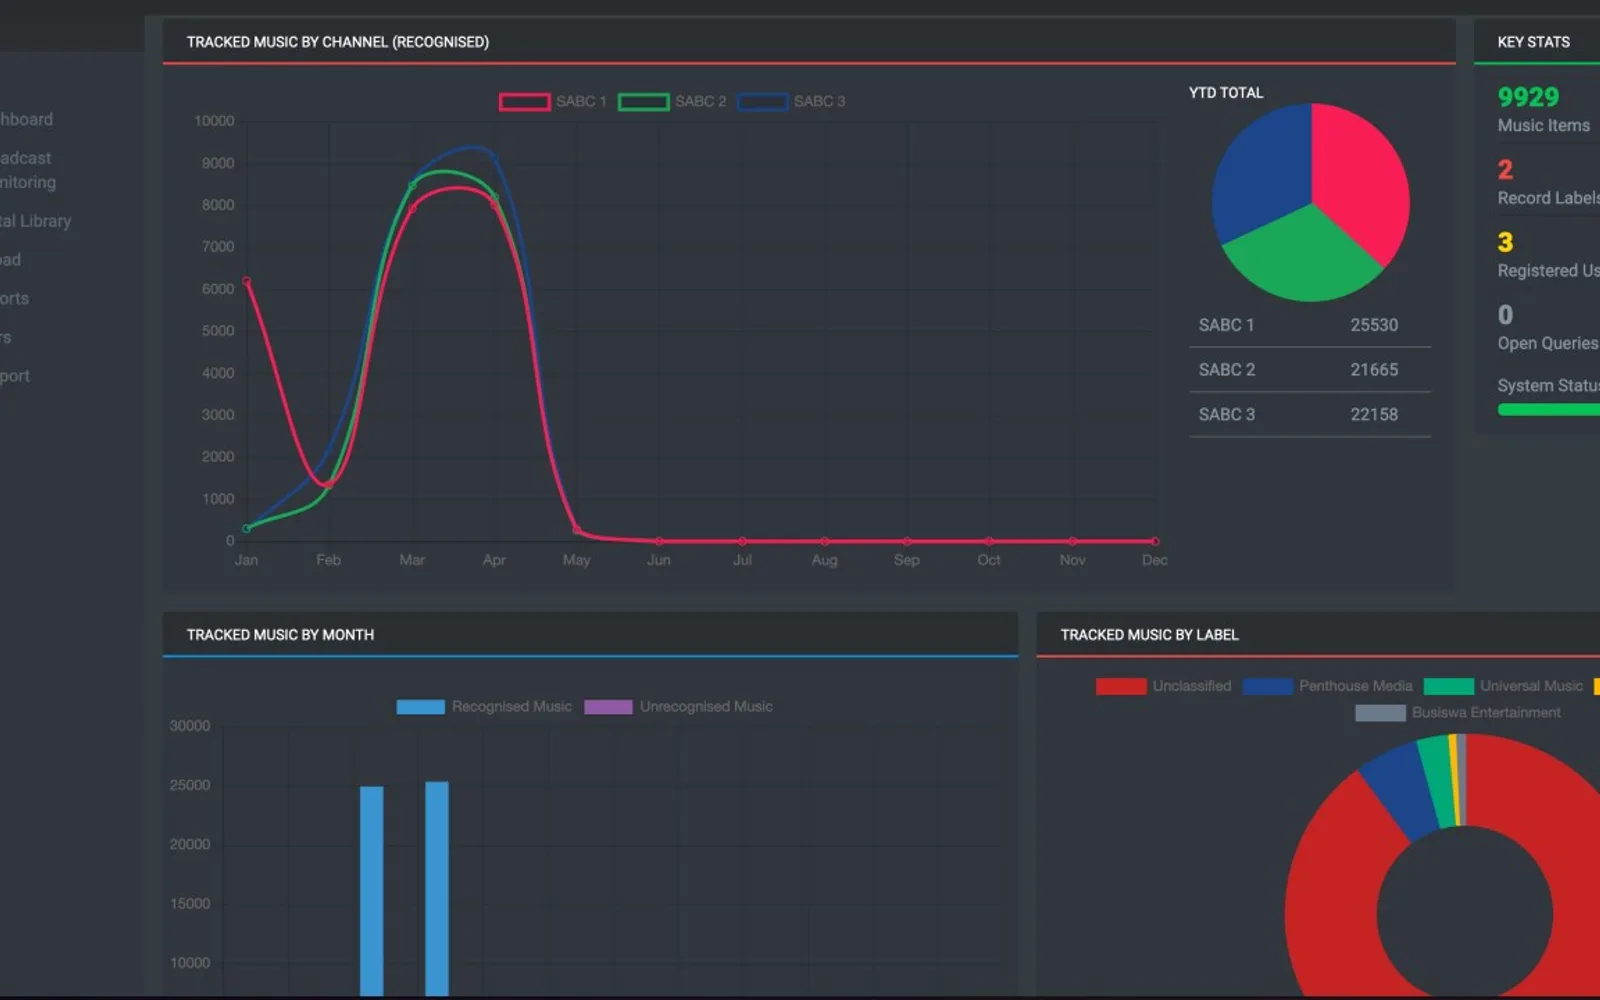
iMonitor monitors radio, television, internet streams, and venues according to customer requirements. Clients can submit audio for fingerprint creation and add live streams for identification and monitoring. It supplies metadata for rights distribution, market intelligence, and tracking content performance and use.
Generates an identifier for submitted audio that supports recognition across different platforms.
Records when and where content appears on broadcast and streaming services, including how it is used.
Recognizes music played in clubs, restaurants, retailers, and other music venues.
Measures content placement across broadcast and streaming channels.
Industry bodies, creative and production entities, broadcasters, and advertisers.
2,531 plugins in Analytics
Price distribution: 125 free, 147 freemium, 1,350 paid, 909 price not published
Creates visualizations from diverse chart types, combines multiple charts on one canvas, and adds custom annotations and tooltips.
Akvelon
Creates financial and business reports in Power BI with automatic variance calculations, P&L logic, and drill-down (s5, s6).
Zebra BI
COSMO Text Module provides extended text management with a WYSIWYG editor for Microsoft Dynamics 365 Business Central.
COSMO CONSULT
Discover the why behind your data.
Data Courage«iMonitor tracks any radio and TV channel based on the customer requirement which can include online streams and venues. Clients can also upload and fingerprint their own custom content and ingest additional live streams for identification and monitoring. The platform provides the metadata that enables reporting for …»