
Power Plot Visual by Akvelon
Creates visualizations from diverse chart types, combines multiple charts on one canvas, and adds custom annotations and tooltips.
AkvelonFreemium
Creates interactive graphs from equations on a canvas or page.

Adds an equation input to a canvas or page. After an equation is entered and confirmed, it displays an interactive graph.
Displays an interactive graph based on an entered equation.
2,531 plugins in Analytics
Price distribution: 125 free, 147 freemium, 1,350 paid, 909 price not published
Creates visualizations from diverse chart types, combines multiple charts on one canvas, and adds custom annotations and tooltips.
Akvelon
Creates financial and business reports in Power BI with automatic variance calculations, P&L logic, and drill-down (s5, s6).
Zebra BI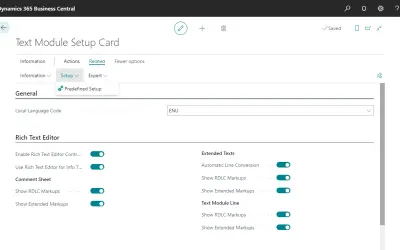
COSMO Text Module provides extended text management with a WYSIWYG editor for Microsoft Dynamics 365 Business Central.
COSMO CONSULT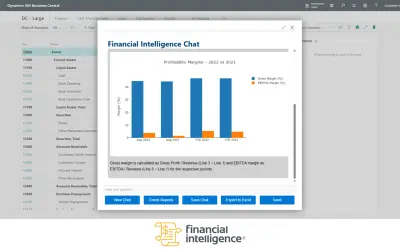
Discover the why behind your data.
Data Courage«Just insert it onto your canvas/page, and enter an equation. The text box will automatically accomodate math view! When you are done typing, hit Enter. And voila! An interactive graph for your equation is ready to play with!»