
Power Plot Visual by Akvelon
Creates visualizations from diverse chart types, combines multiple charts on one canvas, and adds custom annotations and tooltips.
AkvelonFreemium
Tracks construction elements, supply-chain stages, and project progress in an interactive 3D web environment.
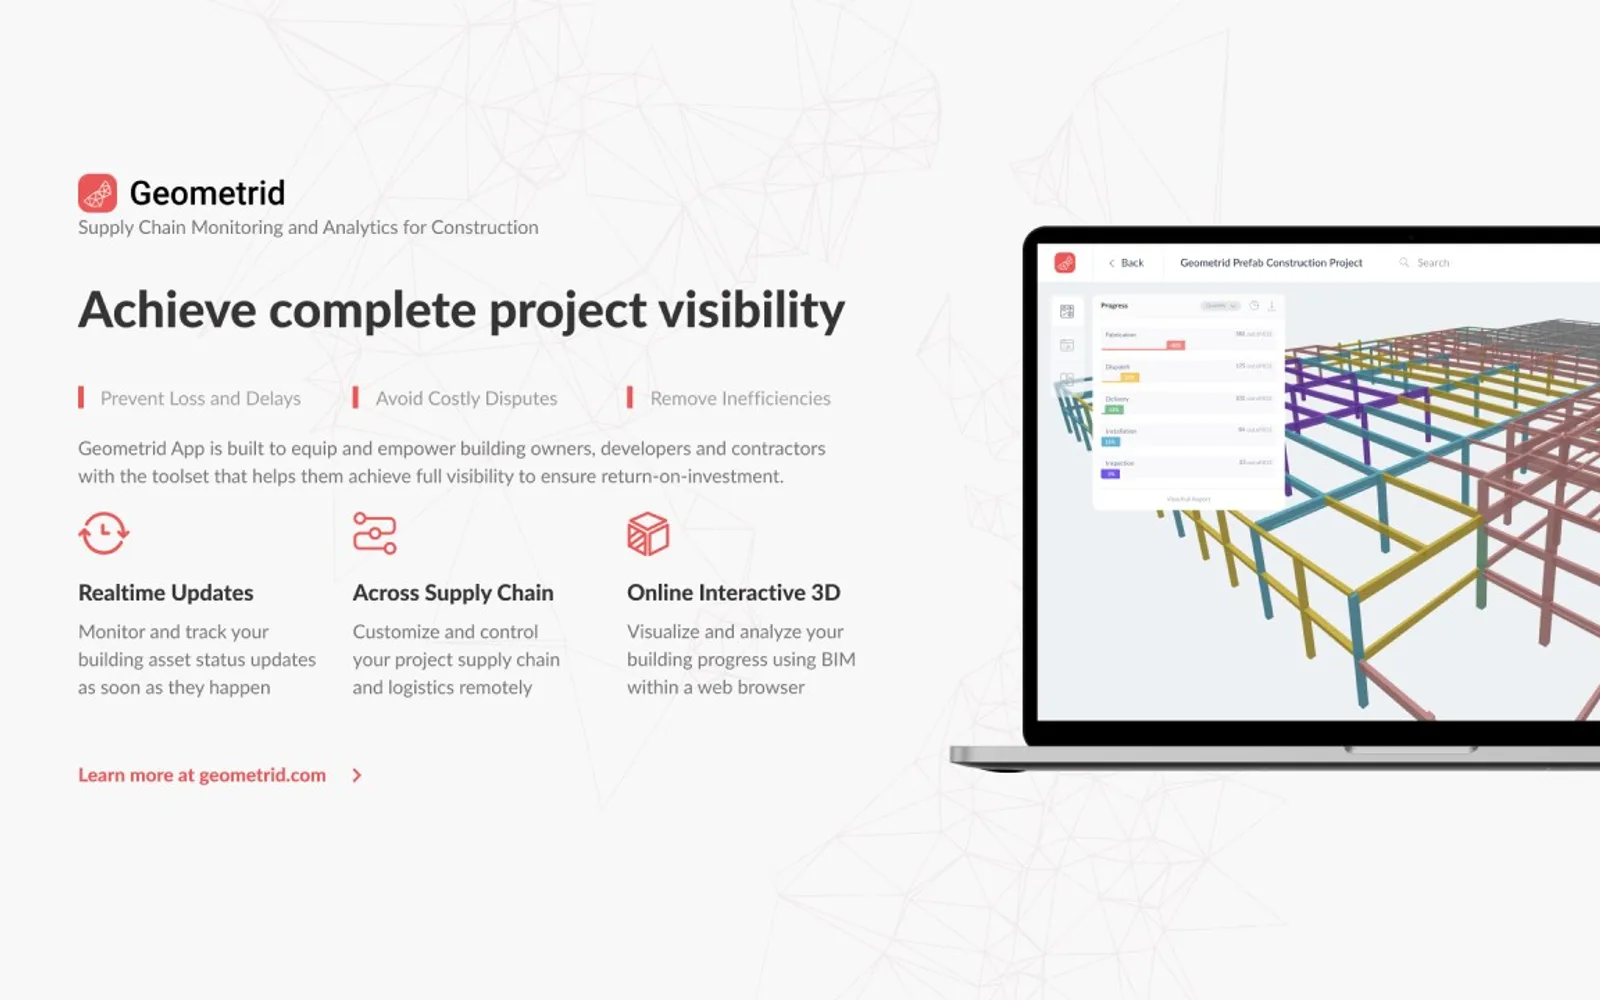
Geometrid displays construction supply-chain information in an interactive 3D environment within a web browser. BIM models can be added, with each element assigned a unique QR code. Users can define supply-chain stages and receive status updates through QR scans. The platform provides element tracking, progress monitoring, analytics, and reporting.
Adds BIM models and assigns each element a unique QR code.
Allows supply-chain stages to be added and customized to existing workflows.
Provides status updates when users scan QR codes remotely.
Shows element tracking and construction progress in an interactive 3D environment.
Provides analytics and reporting for construction project monitoring.
Building owners, developers, contractors, and construction professionals.
2,531 plugins in Analytics
Price distribution: 125 free, 147 freemium, 1,350 paid, 909 price not published
Creates visualizations from diverse chart types, combines multiple charts on one canvas, and adds custom annotations and tooltips.
Akvelon
Creates financial and business reports in Power BI with automatic variance calculations, P&L logic, and drill-down (s5, s6).
Zebra BI
COSMO Text Module provides extended text management with a WYSIWYG editor for Microsoft Dynamics 365 Business Central.
COSMO CONSULT
Discover the why behind your data.
Data Courage«Geometrid is a software as a service that enables construction project stakeholders to achieve complete visibility across their supply chain. Building owners, developers, and contractors get realtime updates in an interactive 3D environment for element tracking, progress monitoring, analytics, and reporting, all …»