
Power Plot Visual by Akvelon
Creates visualizations from diverse chart types, combines multiple charts on one canvas, and adds custom annotations and tooltips.
AkvelonFreemium
Displays geographic data ranges on a map with summary views and multiple values per location.
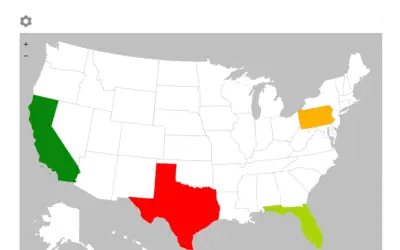
Displays value ranges across geographies and provides a summary view of the data. Supports multiple values for a geographic location and charts data across the United States in version 1.0.
Displays a range of values across different geographies.
Provides a summary view of the data.
Supports multiple values for a geographic location.
Version 1.0 can chart data across the United States.
2,531 plugins in Analytics
Price distribution: 125 free, 147 freemium, 1,350 paid, 909 price not published
Creates visualizations from diverse chart types, combines multiple charts on one canvas, and adds custom annotations and tooltips.
Akvelon
Creates financial and business reports in Power BI with automatic variance calculations, P&L logic, and drill-down (s5, s6).
Zebra BI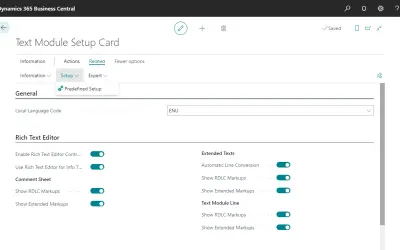
COSMO Text Module provides extended text management with a WYSIWYG editor for Microsoft Dynamics 365 Business Central.
COSMO CONSULT
Discover the why behind your data.
Data Courage«Use this app to view a range of values across different geographies. This map will also provide a summary view of your data. It also supports multiple values for a certain geographic location. Version 1.0 contains the ability to chart data across United States.»