
Gantt Chart
Gantt Chart is a project management visual for Microsoft Power BI that tracks schedules, milestones, and resource workloads.
ChartPadFree
Builds schedule views in Power BI with timeline bars, baselines, milestones, and nested work categories.
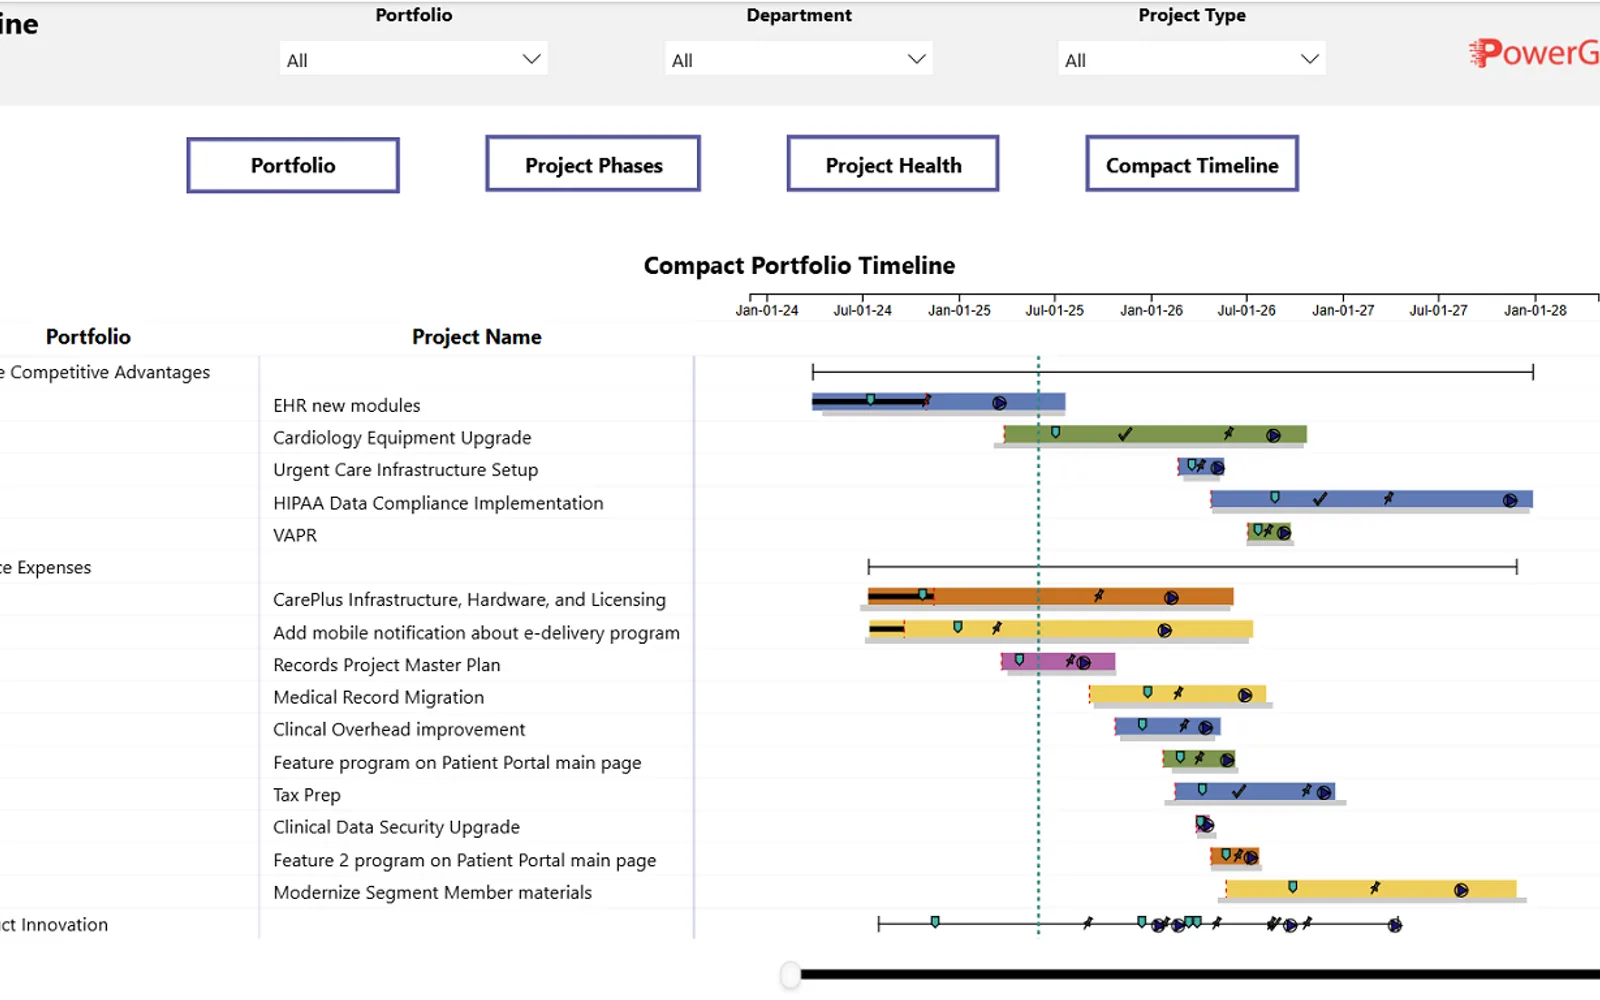
PowerGraph Timeline displays portfolio, program, and project schedules in Power BI. It can combine information from multiple projects and sources, with timeline bars, baseline bars, milestone icons, and text. The visual supports nested categories, parent rollups, category headers, grids, and optional summary bars. Listed sources include OnePlan, Microsoft Project, Microsoft DevOps, Jira, and Smartsheet.
Shows schedule information with timeline bars, baseline bars, milestone icons, and text.
Supports unlimited category levels and optional headers for categories.
Provides a horizontal category grid with formatting options.
Rolls parent categories up at any level.
Displays optional summary bars and can place milestones on rolled-up summary bars.
Can display data from OnePlan, Microsoft Project products, Microsoft DevOps, Jira, Smartsheet, and other sources.
Gantt Timeline is listed as freemium, while Gantt Chart and Apex Gantt Chart - Project Timeline are listed as free. All three list cloud deployment. UpSlide Gantt Charts for PowerPoint also lists cloud deployment, with an unknown pricing model. The alternatives show update dates of Aug 2026, Mar 2026, and May 2026, respectively.
| Name | Pricing | Deployment | Updated |
|---|---|---|---|
| this plugin | Freemium | Cloud | |
| Gantt Chart | Free | Cloud | |
| Apex Gantt Chart - Project Timeline | Free | Cloud | |
| UpSlide Gantt Charts for PowerPoint | Price not published | Cloud |
8 plugins in Power BI · Project Management
Price distribution: 3 free, 2 freemium, 1 paid, 2 price not published
Gantt Chart is a project management visual for Microsoft Power BI that tracks schedules, milestones, and resource workloads.
ChartPad
Gantt chart visual for Microsoft Power BI that displays project timelines using Primavera P6 and Microsoft Project data.
APEX Project Management Inc.
UpSlide Gantt Charts for PowerPoint generates and formats project timelines directly on slides using drag-and-drop controls.
UpSlide
Creates visualizations from diverse chart types, combines multiple charts on one canvas, and adds custom annotations and tooltips.
Akvelon«See your portfolio, program and project work plans & roadmaps with the PowerGraph Timeline Gantt visual. Display elements including timeline bars, baseline bars, more than 40 milestone icons, and text, with data from one or multiple projects/programs/portfolios coming from one or multiple sources.»