
Power Plot Visual by Akvelon
Creates visualizations from diverse chart types, combines multiple charts on one canvas, and adds custom annotations and tooltips.
AkvelonFreemium
Autofills missing spreadsheet table values with neural-network predictions.
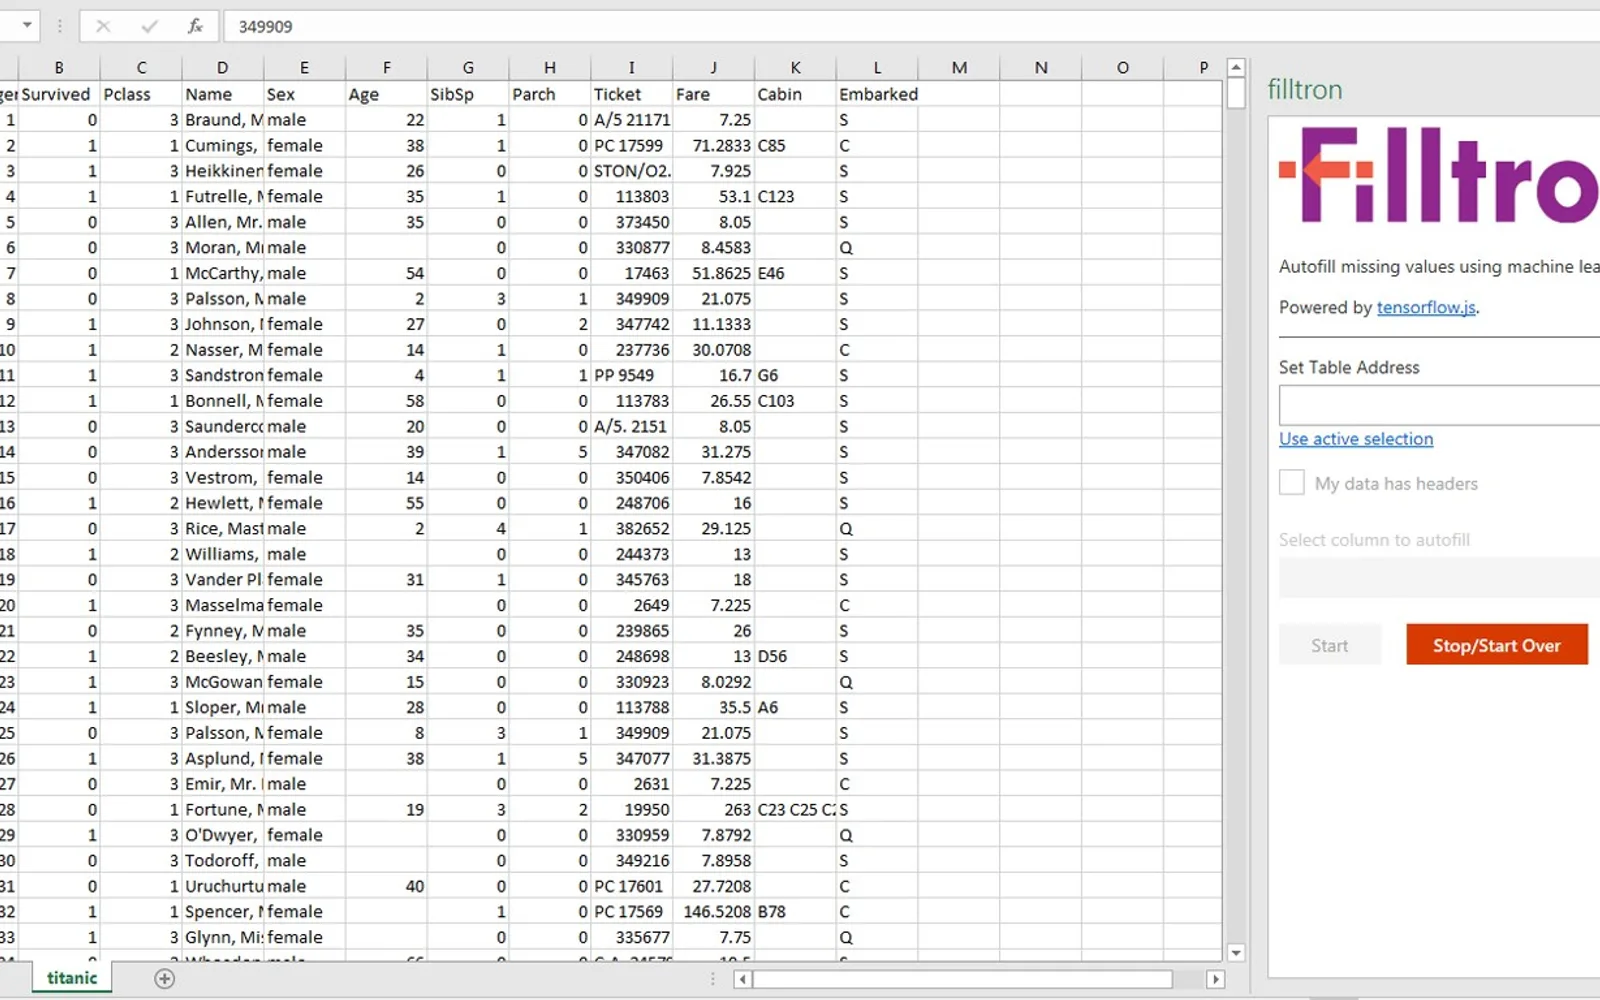
Filltron operates on a spreadsheet table with one output column and other columns used as model inputs. It generates a machine-learning model using dense and embedding layers, then trains the model with TensorFlow.js. After each training epoch, it generates values for cells that were initially empty in the output column. Generated values remain in the spreadsheet when the process is stopped and are highlighted in light blue.
Generates predictions for empty cells in a selected output column.
Uses a selected spreadsheet table with one output column and other columns as model inputs.
Creates and trains a machine-learning model composed of dense and embedding layers.
Accepts numbers and label text such as true/false, language labels, and genre labels.
Displays progress and provides a button to stop the process or start over.
2,531 plugins in Analytics
Price distribution: 125 free, 147 freemium, 1,350 paid, 909 price not published
Creates visualizations from diverse chart types, combines multiple charts on one canvas, and adds custom annotations and tooltips.
Akvelon
Creates financial and business reports in Power BI with automatic variance calculations, P&L logic, and drill-down (s5, s6).
Zebra BI
COSMO Text Module provides extended text management with a WYSIWYG editor for Microsoft Dynamics 365 Business Central.
COSMO CONSULT
Discover the why behind your data.
Data Courage«Make machine learning powered predictions from the safety and comfort of your own spreadsheet. Autofill missing values with neural networks. Powered by TensorFlow.js. This tool operates on a spreadsheet table. One column is identified as the output/prediction column, and the others are treated as inputs to the machine …»