
Power Plot Visual by Akvelon
Creates visualizations from diverse chart types, combines multiple charts on one canvas, and adds custom annotations and tooltips.
AkvelonFreemium
Visualizes hierarchical data in radial rings with interactive drill-down across multiple levels.
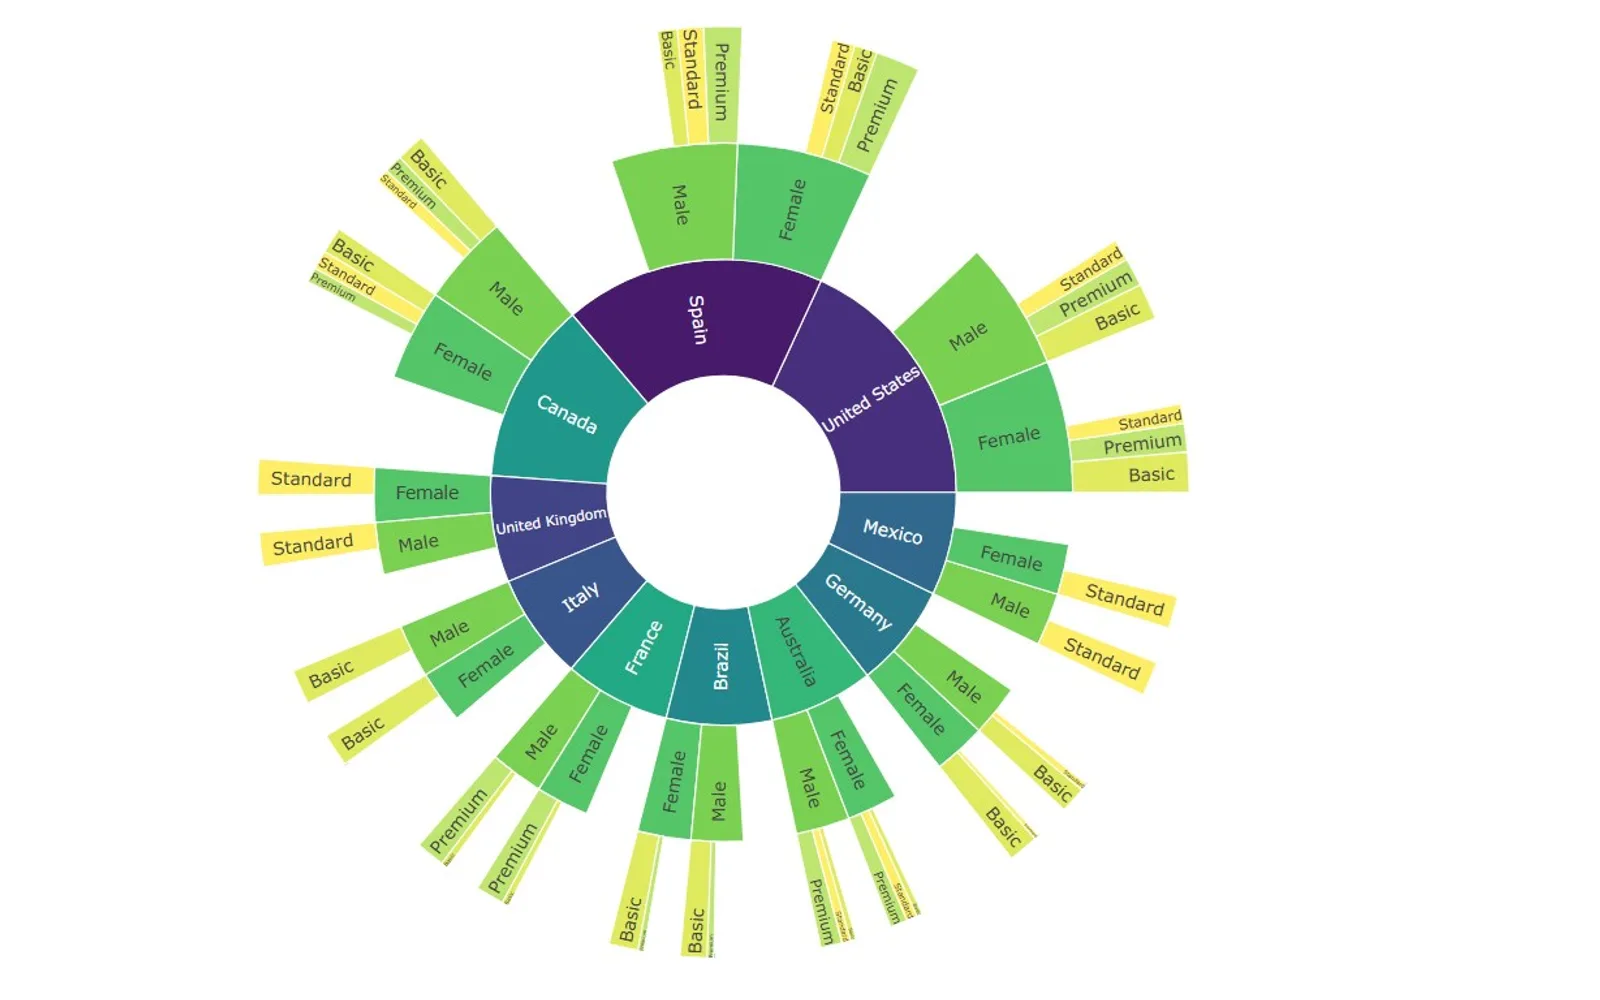
FanTail presents hierarchical data as concentric rings divided into segments based on parent-child relationships. Sector width and sector color can represent measures such as sales breakdowns and call success rates. Users can drill down through hierarchy levels to examine data in more detail.
Displays parent-child relationships through concentric rings arranged from central to outer levels.
Supports movement through multiple levels of a data hierarchy.
Divides rings into segments to show the contribution of dimensions within a hierarchy.
Uses sector width and sector color to represent different measures.
Can access external services or resources.
The vendor names leadership at all levels as users of the visual.
2,531 plugins in Analytics
Price distribution: 125 free, 147 freemium, 1,350 paid, 909 price not published
Creates visualizations from diverse chart types, combines multiple charts on one canvas, and adds custom annotations and tooltips.
Akvelon
Creates financial and business reports in Power BI with automatic variance calculations, P&L logic, and drill-down (s5, s6).
Zebra BI
COSMO Text Module provides extended text management with a WYSIWYG editor for Microsoft Dynamics 365 Business Central.
COSMO CONSULT
Discover the why behind your data.
Data Courage«The FanTail Imagine peeling an onion – layer by layer – revealing deeper insights at each level. That’s precisely what our Fantail does but without the tears! Each layer tells a part of your data story from the core to the outer rings, making it simple to grasp even the most complex hierarchies. The …»