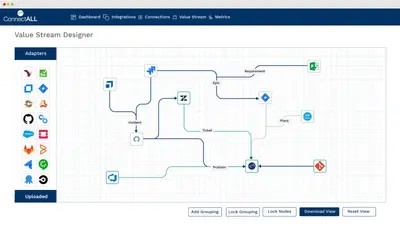
Flow, DevOps, Agile and Quality Metrics for Jira and More
Measures flow, DevOps, business and quality metrics across Jira and other delivery tools.
ConnectALLPaid
Aggregates Jira data across projects for sprint, defect, throughput, and investment reporting.
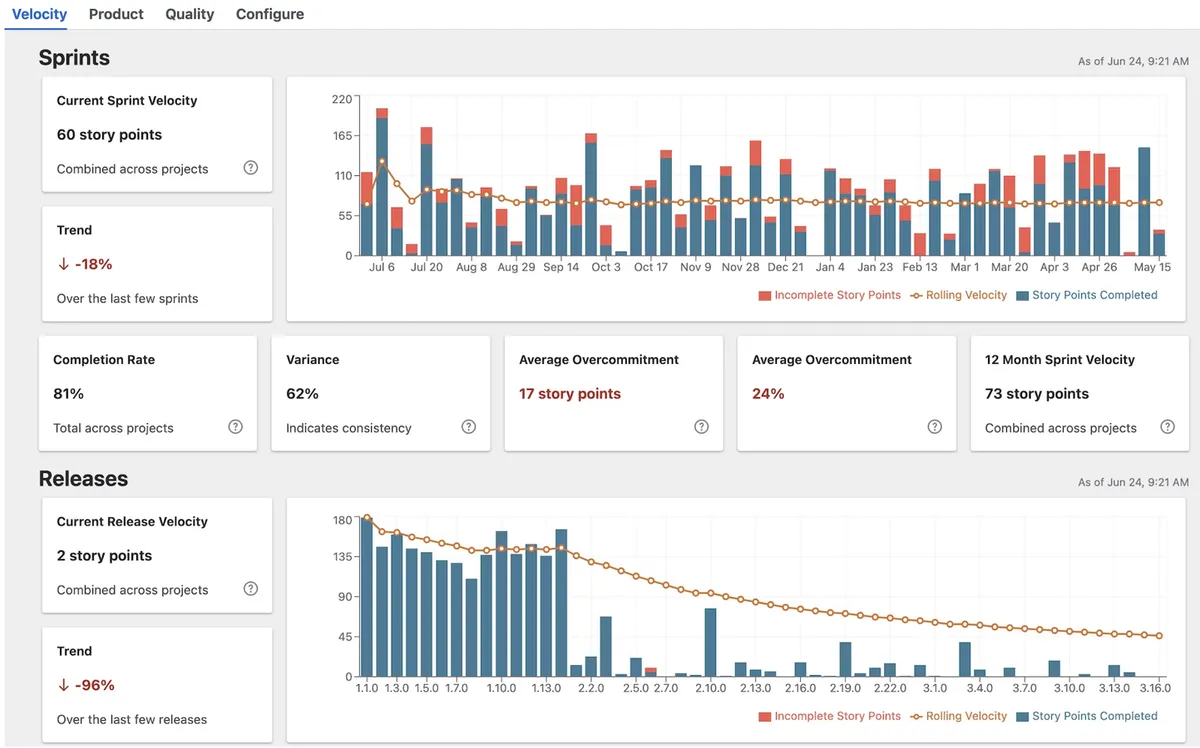
Enterprise Dashboard calculates metrics from Jira data across multiple projects. It reports velocity, cycle time, issue health, and innovation throughput. Quality reporting includes bugs opened and closed by priority and version, defect ratio, and average bug lead time. Investment reporting covers monthly created and closed ticket counts, closed story points by category, and ticket priority distribution.
Computes aggregated metrics from Jira data across multiple projects.
Reports velocity and cycle time across projects.
Shows bugs opened and closed by priority and version, along with defect ratio and average bug lead time.
Displays monthly counts of created and closed tickets across projects.
Shows the share of closed story points by category and the distribution of created and closed tickets by priority.
The vendor names VPs, EMs, and ICs.
Enterprise Dashboard is freemium and cloud-only, while Agile velocity charts: gadget reports on Jira Dashboard is paid and supports cloud, server, and data-center deployment. Enterprise Dashboard was updated in Jun 2026, while Time in Status report, Cycle Time & Lead Time Chart for Jira is freemium, cloud-only, and was updated in Sep 2026.
| Name | Pricing | Deployment | Updated |
|---|---|---|---|
| this plugin | Freemium | Cloud | |
| Agile velocity charts: gadget reports on Jira Dashboard | Paid | Cloud · Data Center · Server | |
| Time in Status report, Cycle Time & Lead Time Chart for Jira | Freemium | Cloud |
630 plugins in Jira · Data and analytics
Price distribution: 189 free, 230 freemium, 211 paid
Measures flow, DevOps, business and quality metrics across Jira and other delivery tools.
ConnectALL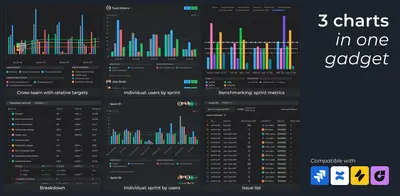
Create Scrum, Kanban, and SAFe velocity charts with sprint metrics and benchmarks inside Jira.
Broken Build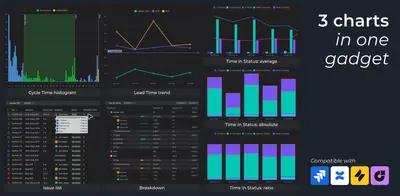
Analyze cycle time, lead time, and time in status with charts and reports in Jira.
Broken Build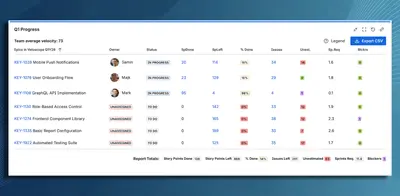
Forecasts epic delivery timing in Jira from remaining story points and sprint velocity.
Veloscope«Stop cobbling together spreadsheets. Jira Enterprise Dashboard gives every VP, EM, and IC a single source of truth. Cross-team metrics computed automatically from your Jira data. No manual tracking. Roll up velocity, cycle time, and issue health across every project in your organization. See the forest and the trees …»