
AI Financial Intelligence
Discover the why behind your data.
Data CouragePaid
Creates waterfall charts in Power BI to show cumulative values and explain variance between reference figures.
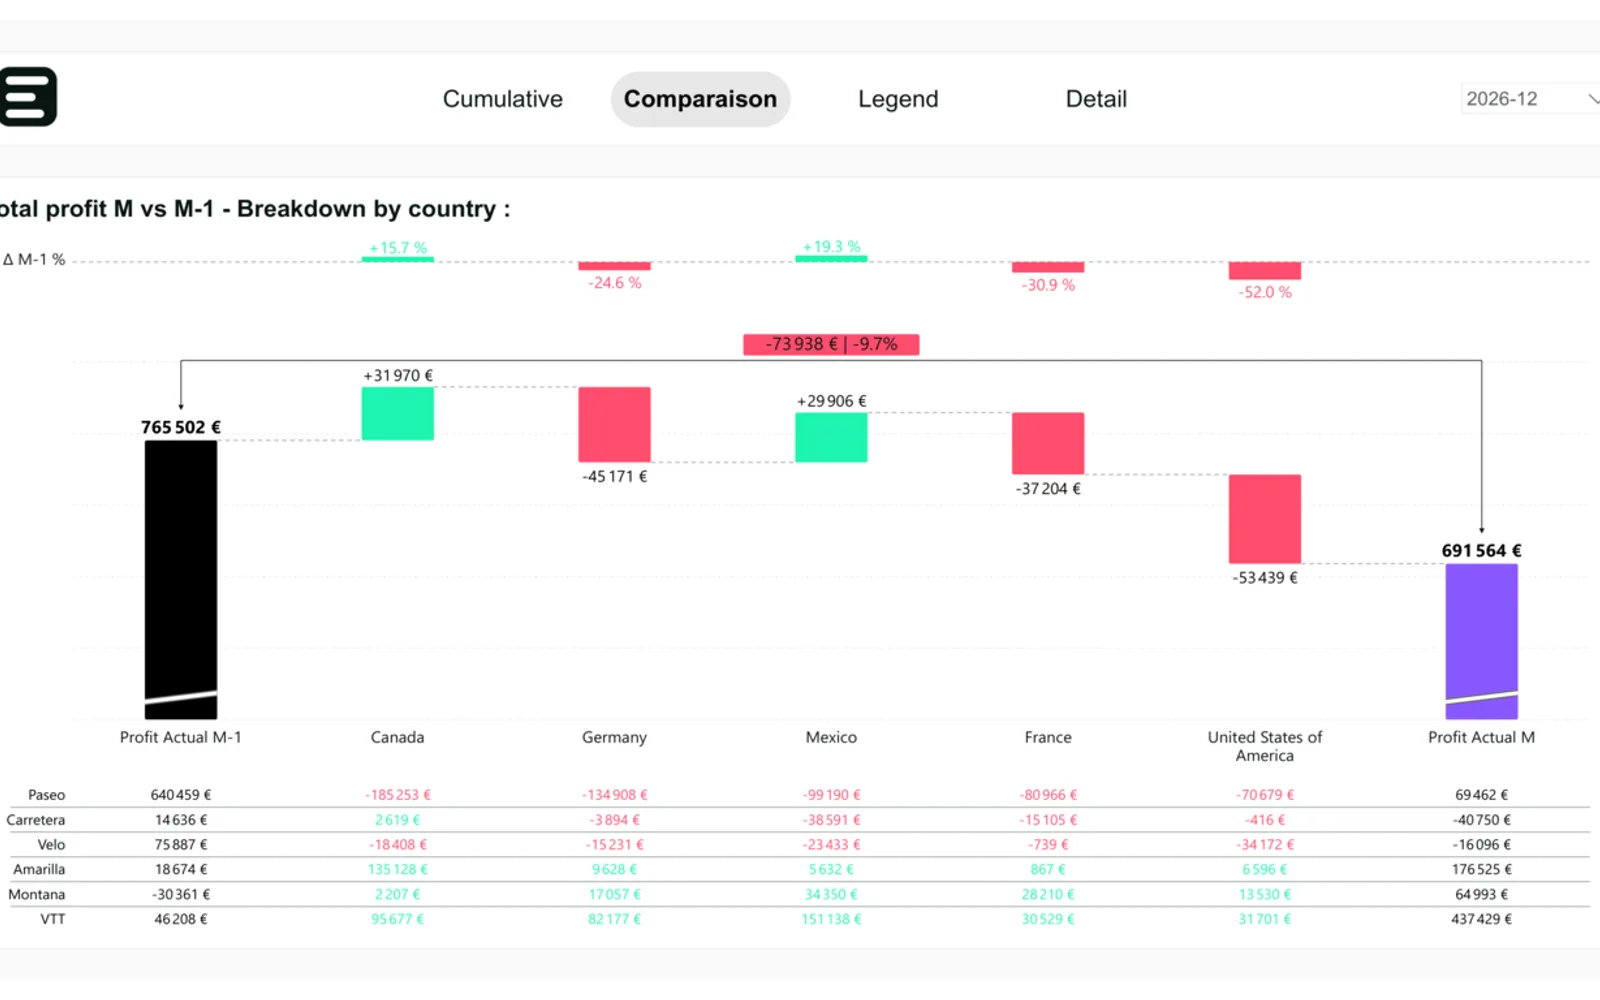
Eclor Waterfall creates waterfall charts in Power BI for financial reporting. Cumulative mode builds a running total across pillars, while comparison mode places reference pillars alongside bridge bars that break down their variance. The chart can show variation arcs, an optional supporting table, formatting controls, tooltips, and drill-down. It also supports conventions for actuals, plans, forecasts, and positive or negative variance.
Chains pillars into a running total for views such as cost, cash flow, or headcount changes.
Places reference pillars beside bridge bars that decompose the variance between them.
Connects consecutive pillars and labels the absolute change, percentage change, or both.
Adds an optional table aligned with the chart columns for supporting information.
Uses notation for actuals, plans, forecasts, and positive or negative variance based on IBCS.
Provides formatting controls, high-contrast mode, report-page tooltips, and drill-down support.
Finance and FP&A teams, controllers, business analysts, and people who present results, budgets, or forecasts.
AI Financial Intelligence is also a paid cloud listing, while Kaaria and Aleph Assistant have unknown pricing models and cloud deployment. Kaaria was updated in Sep 2023, compared with Aug 2026 for Eclor Waterfall; Aleph Assistant was updated in Jan 2026. AI Financial Intelligence was updated in Aug 2026, the same month as Eclor Waterfall.
| Name | Pricing | Deployment | Updated |
|---|---|---|---|
| this plugin | Paid | Cloud | |
| AI Financial Intelligence | Paid | Cloud | |
| Kaaria | Not in catalog | ||
| Aleph Assistant | Price not published | Cloud | |
1,651 plugins in Power BI · Analytics
Price distribution: 90 free, 139 freemium, 707 paid, 715 price not published
Discover the why behind your data.
Data Courage
Aleph Assistant delivers real-time alerts and AI-generated answers to financial data questions inside Microsoft Teams.
Aleph Labs Inc
Gantt Chart is a project management visual for Microsoft Power BI that tracks schedules, milestones, and resource workloads.
ChartPad
Creates visualizations from diverse chart types, combines multiple charts on one canvas, and adds custom annotations and tooltips.
Akvelon«Eclor Waterfall is an advanced waterfall chart built for financial reporting and communication. In a single visual it turns a chain of values into a clear story of how a starting figure becomes a final one, making every increase, decrease and above all the variance between values immediately readable for your audience.»