
Power Plot Visual by Akvelon
Creates visualizations from diverse chart types, combines multiple charts on one canvas, and adds custom annotations and tooltips.
AkvelonFreemium
Present values across categories in a horizontal lollipop chart.
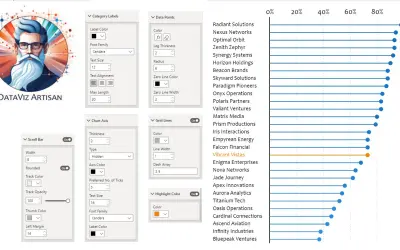
Displays data points as dots connected by lines in a horizontal lollipop chart. Supports comparisons across categories and can represent distributions, frequencies, and comparative data. The vendor names business intelligence and research as application areas.
Represents data points with dots connected by lines.
Compares values across categories.
Represents statistical distributions, frequencies, and comparative data.
2,531 plugins in Analytics
Price distribution: 125 free, 147 freemium, 1,350 paid, 909 price not published
Creates visualizations from diverse chart types, combines multiple charts on one canvas, and adds custom annotations and tooltips.
Akvelon
Creates financial and business reports in Power BI with automatic variance calculations, P&L logic, and drill-down (s5, s6).
Zebra BI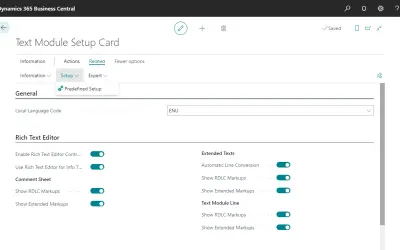
COSMO Text Module provides extended text management with a WYSIWYG editor for Microsoft Dynamics 365 Business Central.
COSMO CONSULT
Discover the why behind your data.
Data Courage«The Dot Chart, the horizontal lollipop chart, is a versatile and intuitive data visualization tool designed to present your data clearly and engagingly. It utilizes simple dots to represent data points linked by lines that guide the eye, making patterns, trends, and outliers instantly recognizable. This visual is …»