
Power Plot Visual by Akvelon
Creates visualizations from diverse chart types, combines multiple charts on one canvas, and adds custom annotations and tooltips.
AkvelonFreemium
Manage daily operations with visual boards, KPI displays, task tracking, projects, incidents, improvements, and A3 tools.
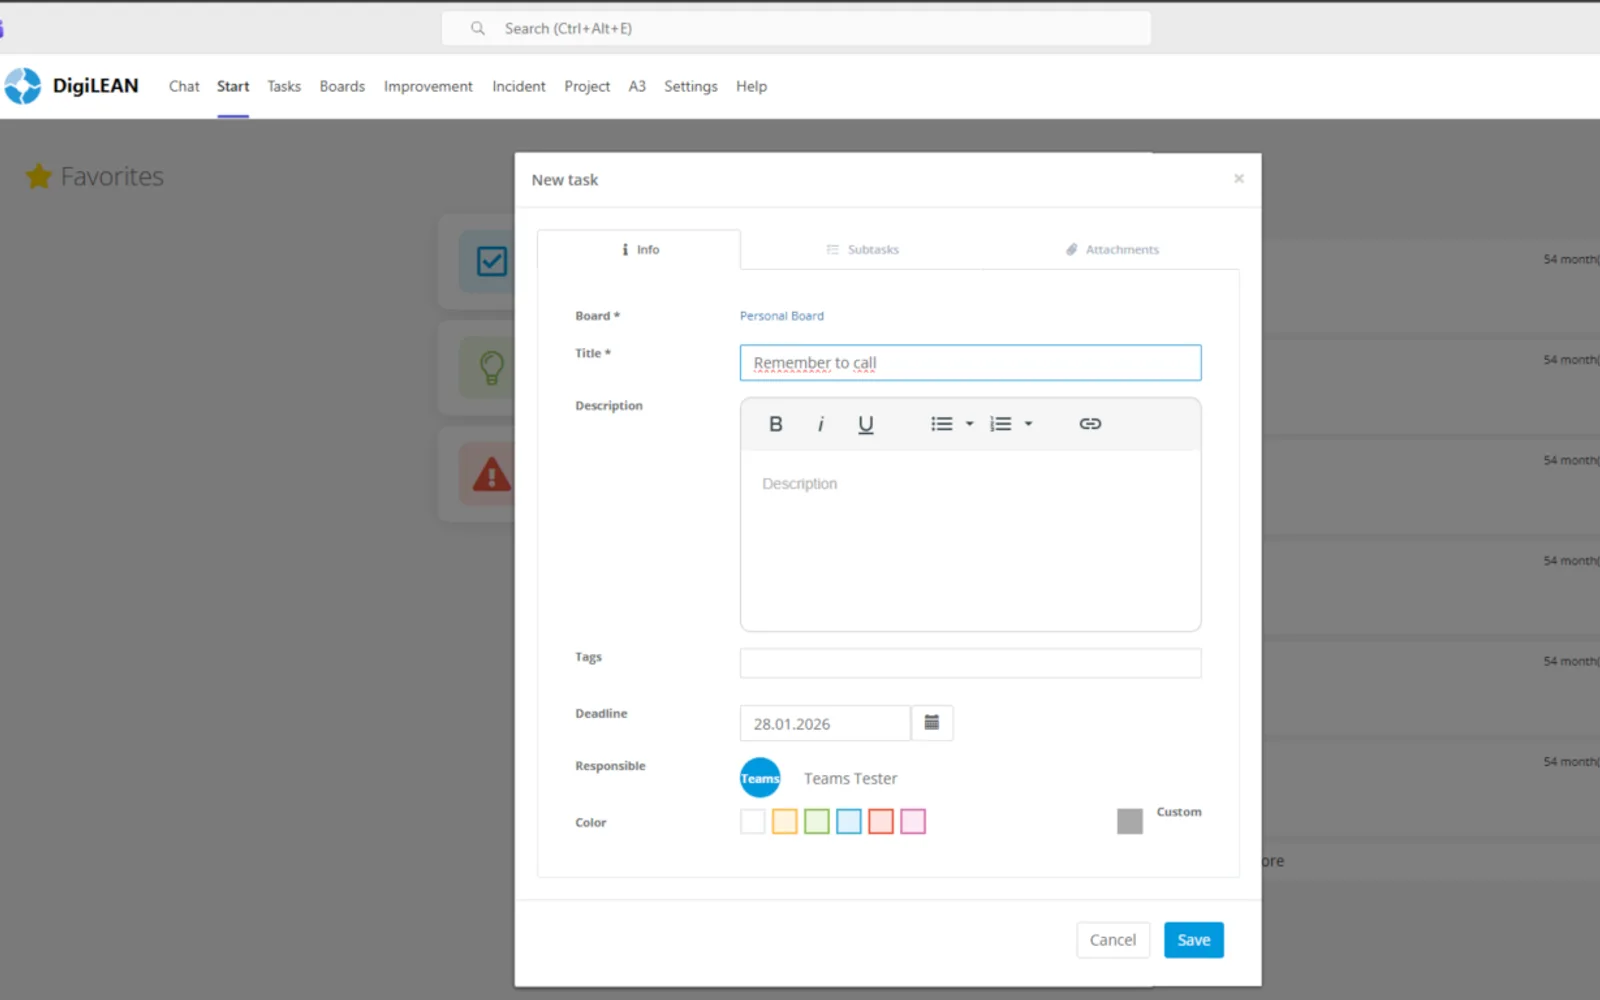
DigiLEAN provides visual boards for performance data and KPIs. It includes task management boards for daily activities, project tables and boards, and tools for managing improvement suggestions and incidents. The platform also supports planning, reporting, information sharing, remote collaboration, and structured A3 problem solving.
Create visual boards using drag-and-drop actions.
Visualize key performance indicators.
Track daily activities with task management boards.
Manage improvement suggestions.
Manage incidents.
Manage projects with dynamic project tables and boards.
Use structured A3 tools for problem solving.
2,531 plugins in Analytics
Price distribution: 125 free, 147 freemium, 1,350 paid, 909 price not published
Creates visualizations from diverse chart types, combines multiple charts on one canvas, and adds custom annotations and tooltips.
Akvelon
Creates financial and business reports in Power BI with automatic variance calculations, P&L logic, and drill-down (s5, s6).
Zebra BI
COSMO Text Module provides extended text management with a WYSIWYG editor for Microsoft Dynamics 365 Business Central.
COSMO CONSULT
Discover the why behind your data.
Data Courage«Manage your daily operations with our all-in-one platform. Everything from performance boards to incident- and improvement management. With our visual management toolbox, you can easily visualize your performance data, design your boards, and engage your team in planning and reporting. This reduces the need to pull …»