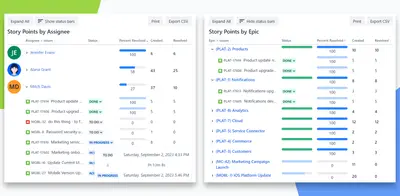
Status & Progress Report, Sum Up Dashboard Gadget for Jira
Track Jira project progress by summing issues, story points, or time estimates with configurable dashboard reports.
Agilis LT (Simple Reports)Freemium
Tracks Jira delivery progress, release and epic status, and time in progress versus flagged time through dashboard gadgets.
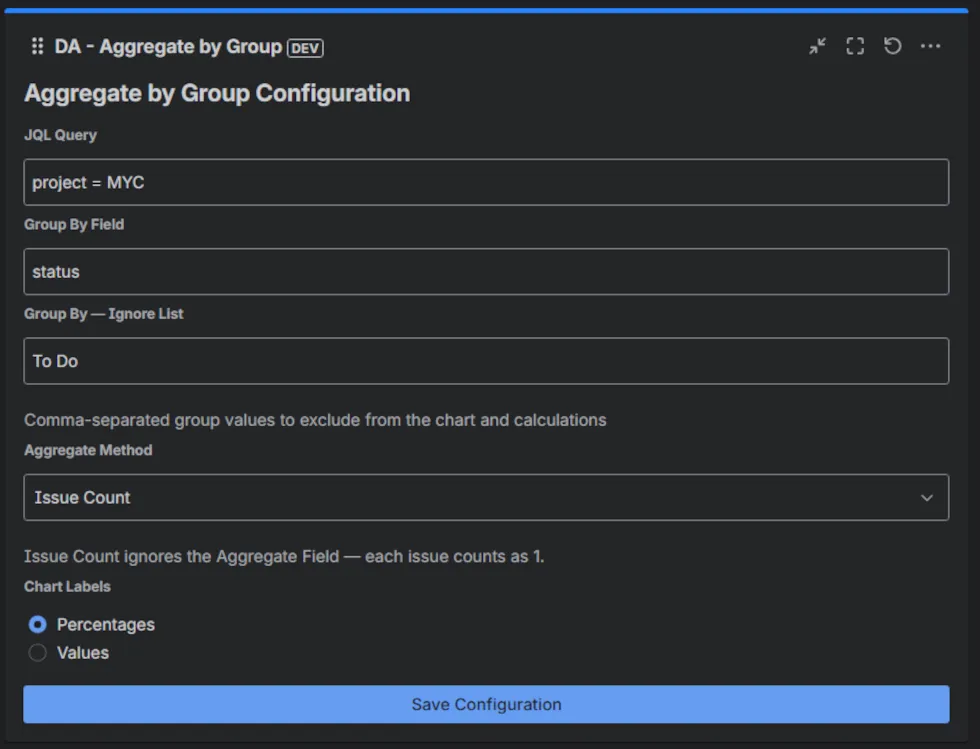
Delivery Analytics Dashboard adds configurable Jira dashboard gadgets for delivery tracking. Each gadget can use JQL queries to select the data shown, with Light and Dark modes available. It reports release burnup, overall release progress, and epic progress, including time in progress versus flagged time. It also compares delivery pace with the pace required to reach a release date.
Each dashboard gadget can be configured with JQL queries.
The dashboard reports release burnup and overall release progress.
The dashboard reports progress for epics.
The dashboard compares time in progress with time issues were flagged.
The dashboard compares delivery pace with the pace required to reach a release date.
The dashboard supports Light and Dark modes.
Teams tracking delivery progress in Jira.
Delivery Analytics Dashboard is freemium and cloud-based, while Status & Progress Report, Sum Up Dashboard Gadget for Jira is freemium and available on data-center, cloud, and server. Delivery Analytics Dashboard was updated in Jul 2026, while Status & Progress Report. Sprint Health Analyzer: Velocity, Burndown, Burnup for Jira is paid and cloud-based, was updated in May 2026.
| Name | Pricing | Deployment | Updated |
|---|---|---|---|
| this plugin | Freemium | Cloud | |
| Status & Progress Report, Sum Up Dashboard Gadget for Jira | Freemium | Cloud · Data Center · Server | |
| Progress | Freemium | Cloud | |
| Sprint Health Analyzer: Velocity, Burndown, Burnup for Jira | Paid | Cloud |
630 plugins in Jira · Data and analytics
Price distribution: 189 free, 230 freemium, 211 paid
Track Jira project progress by summing issues, story points, or time estimates with configurable dashboard reports.
Agilis LT (Simple Reports)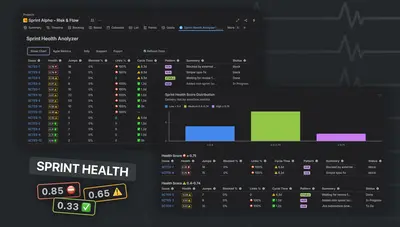
Analyze Jira sprint health with Agile metrics, risk signals, charts, and report exports.
TypeSwitch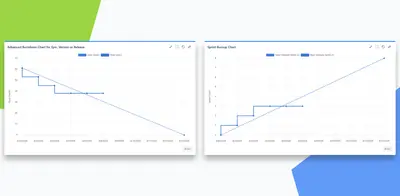
Create Jira dashboard burndown and burnup charts for sprints, epics, releases, versions, or JQL-filtered data.
Agilis LT (Simple Reports)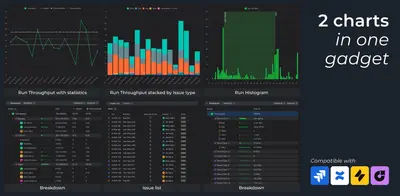
Creates throughput run and histogram charts in Jira dashboards from Scrum, Kanban, SAFe, project, release, epic, and JQL data.
Broken Build«Highly configurable using JQL configuration to enable you to see just the data you are interested in Supports Light and Dark modes Understand your delivery pace vs required pace to release your release date Release and Epic progress reporting on your Dashboard No data leaves your Jira server Track time in progress vs …»