
Power Plot Visual by Akvelon
Creates visualizations from diverse chart types, combines multiple charts on one canvas, and adds custom annotations and tooltips.
AkvelonFreemium
Links data across silos in the DataWalk software platform.
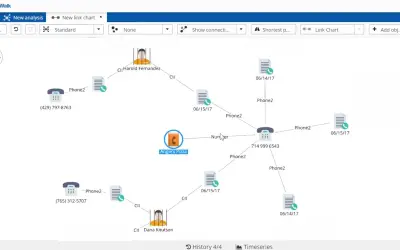
DataWalk combines data from multiple sources in one database. It supports searches across the combined data and analysis through visual queries, link analysis, and geospatial analysis. External sources, including subscription services, social media, and OSINT sources, can be integrated with internal data.
Combines data from multiple internal and external sources in one database.
Searches across combined data sources.
Analyzes data through visual queries.
Analyzes links within connected data.
Analyzes data using geospatial analysis.
2,531 plugins in Analytics
Price distribution: 125 free, 147 freemium, 1,350 paid, 909 price not published
Creates visualizations from diverse chart types, combines multiple charts on one canvas, and adds custom annotations and tooltips.
Akvelon
Creates financial and business reports in Power BI with automatic variance calculations, P&L logic, and drill-down (s5, s6).
Zebra BI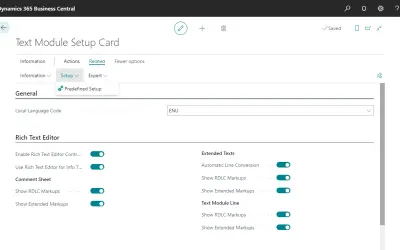
COSMO Text Module provides extended text management with a WYSIWYG editor for Microsoft Dynamics 365 Business Central.
COSMO CONSULT
Discover the why behind your data.
Data Courage«Organizations doing investigations in law enforcement, intelligence, insurance, and other sectors often face challenges trying to access, connect, and analyze large volumes of data across multiple data silos. DataWalk is a software platform that enables you to link all your data together in one database, and then …»