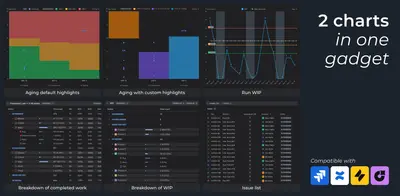
Agile WIP Aging & Run charts for Jira (Gadgets Reports KPIs)
Track Jira work-in-progress aging and volume over time with configurable WIP charts and dashboard gadgets.
Broken BuildPaid
Create Jira reports covering issue trends, historical values, transition timing, work logs, and project or team performance.
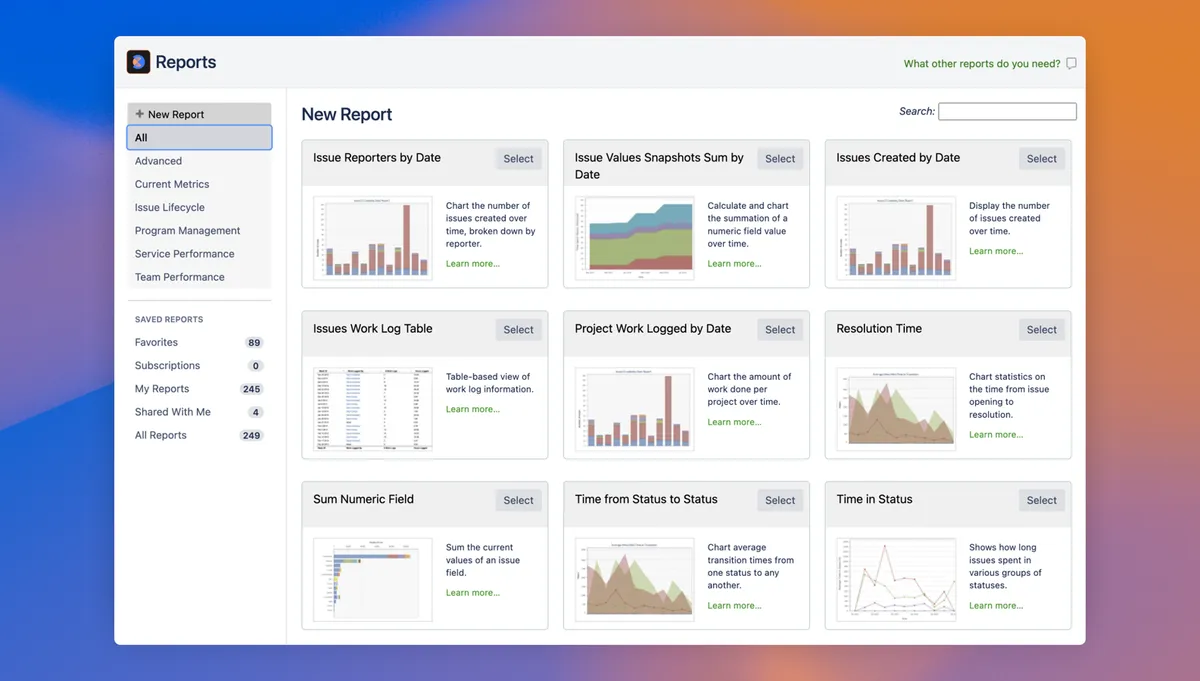
Dataplane Reports for Jira provides built-in reporting for issue trends, logged work, status timing, transitions, burn-up and burn-down charts, issue timelines, and field values. Data can be selected through Jira filters, JQL, projects, or boards. Reports can be saved, shared with team members, placed on Jira dashboards, and included in Confluence pages or subscription emails. Results can be exported as PDF, CSV, or Excel files, and Customizer Scripts can adjust report output and visualizations.
Provides reports covering issue trends, logged work, status timing, transitions, burn-up and burn-down charts, issue timelines, and field values.
Allows custom reports to be created, saved, and run from a report directory.
Allows team members to run and copy customized reports shared with them.
Places Dataplane reports on existing Jira dashboards as gadgets.
Uses existing Jira search filters or custom JQL to select report data.
Exports reports in PDF, CSV, and Excel formats.
Provides scripts for adjusting report results and data visualizations.
The vendor describes the product for enterprise teams and team members.
Dataplane Reports for Jira is paid and supports data-center and server deployment, while Agile WIP Aging & Run charts for Jira (Gadgets Reports KPIs) is paid and data-center only. Cycle Time Gadgets: Time in Status, Trend report for Jira is also paid and supports data-center and server deployment. Dataplane Reports for Jira was updated in Aug 2026, matching Throughput Charts for Scrum, Kanban, SAFe (Gadgets Reports), while the other listed alternatives were updated in Sep 2026.
| Name | Pricing | Deployment | Updated |
|---|---|---|---|
| this plugin | Paid | Data Center · Server | |
| Agile WIP Aging & Run charts for Jira (Gadgets Reports KPIs) | Paid | Data Center | |
| Cycle Time Gadgets: Time in Status, Trend report for Jira | Paid | Data Center · Server | |
| Throughput Charts for Scrum, Kanban, SAFe (Gadgets Reports) | Freemium | Cloud |
630 plugins in Jira · Data and analytics
Price distribution: 189 free, 230 freemium, 211 paid
Track Jira work-in-progress aging and volume over time with configurable WIP charts and dashboard gadgets.
Broken Build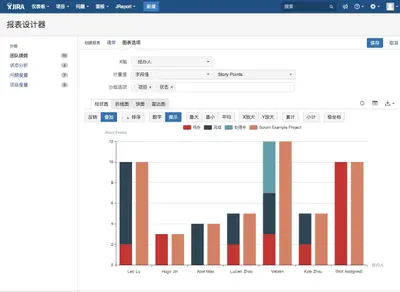
Create Jira reports, charts, and dashboard gadgets from project and issue data.
Shanghai Digital Talent Technology Co., Ltd.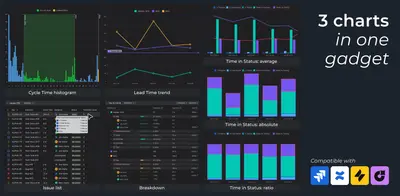
Analyze cycle time, lead time, and time in status with configurable Jira dashboard charts.
Broken Build
Create Jira reports, dashboards, charts and gadgets using templates, filters, and PDF or Excel export.
view26 GmbH«Dataplane Reports™ for Jira delivers powerful, intuitive Jira reports for enterprise teams, allowing you to reach back in time and look at historical trends, the timing of transitions, and project and team performance. PRODUCT OVERVIEW - GET STARTED - FEATURES - TUTORIALS Featuring: Powerful Built-in Reports : track …»